Review
. 2010 Mar;62(2):233-44.
doi: 10.1016/j.brainresrev.2009.12.004. Epub 2009 Dec 21.

How and when the fMRI BOLD signal relates to underlying neural activity: the danger in dissociation

Affiliations
Review

How and when the fMRI BOLD signal relates to underlying neural activity: the danger in dissociation

Arne Ekstrom. Brain Res Rev. 2010 Mar.

Abstract

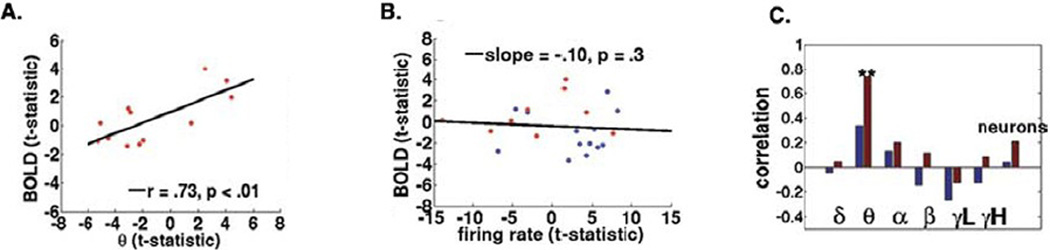
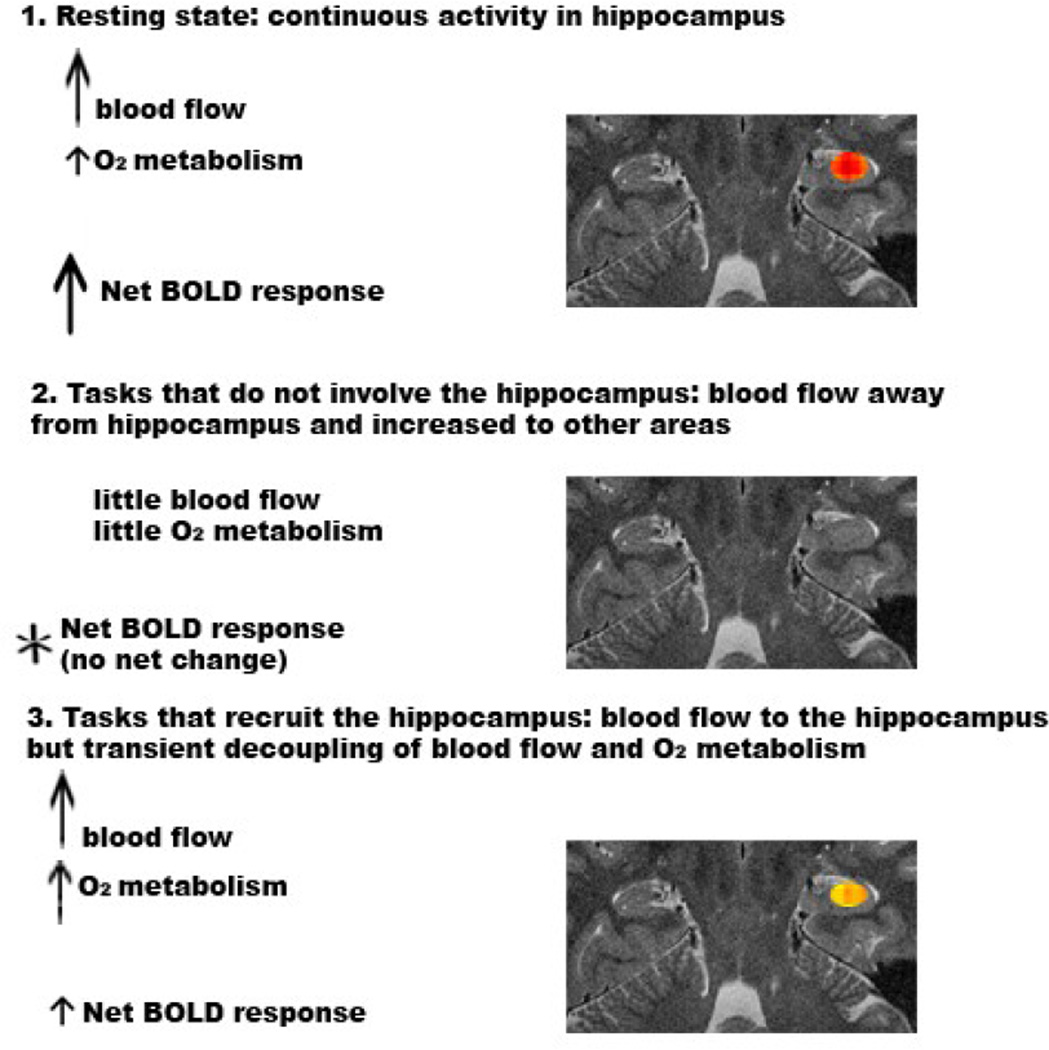
Functional magnetic resonance imaging (fMRI) has become the dominant means of measuring behavior-related neural activity in the human brain. Yet the relation between the blood oxygen-level dependent (BOLD) signal and underlying neural activity remains an open and actively researched question. A widely accepted model, established for sensory neo-cortex, suggests that the BOLD signal reflects peri-synaptic activity in the form of the local field potential rather than the spiking rate of individual neurons. Several recent experimental results, however, suggest situations in which BOLD, spiking, and the local field potential dissociate. Two different models are discussed, based on the literature reviewed to account for this dissociation, a circuitry-based and vascular-based explanation. Both models are found to account for existing data under some testing situations and in certain brain regions. Because both the vascular and local circuitry-based explanations challenge the BOLD-LFP coupling model, these models provide guidance in predicting when BOLD can be expected to reflect neural processing and when the underlying relation with BOLD may be more complex than a direct correspondence.


Figures

Figure 1
Figure 1. Correlations Between Parahippocampal BOLD Activity and LFPs but not between Hippocampal BOLD Activity and LFPs. Neither Parahippocampal nor Hippocampal BOLD Signal Correlated with Spike Rate
A) Maximal BOLD t-statistic vs. maximal theta-band t-statistic for the parahippocampal region (PHR) for electrode ROI in navigation vs. control comparison in 27 electrode recordings from 6 patients with implanted depth electrodes; the correlation coefficient was .73 (r2 = .49). B) Maximal BOLD t-statistic vs. maximal spike rate t-static; the correlation was not significant for spike rate in PHR (red) and hippocampus (blue). C) While there was a weak correlation between hippocampal BOLD and LFPs, this correlation was only significant for parahippocampal BOLD and LFPs. The only LFP-band showing a significant correlation with the BOLD signal was the theta-band LFP.
Figure 2
Figure 2. Schematic representation of hippocampal BOLD response in frequently studied behavioral tasks
Three different scenarios are described along with the predicted BOLD signal. All comparisons are made relative to a “true” hippocampal baseline task, or tasks that do not directly require the hippocampus (such as making odd-even number judgments). In the first situation, “rest” results in increased blood flow due to the involvement of the hippocampus in the default network, resulting in increased activity relative to an “inactive” baseline. In the second situation, tasks not involving the hippocampus (such as familiarity judgments) result in no net BOLD change because two inactive tasks result in no net change. In the final situation, a weakly positive BOLD change arises because hippocampal metabolism may outpace blood flow. Note that if situation #1 were used as baseline for situation #3, as applied in many cases previously, hippocampal negative BOLD changes result.

Similar articles

Cited by

References

    1. Ackermann RF, Finch DM, Babb TL, Engel J., Jr Increased glucose metabolism during long-duration recurrent inhibition of hippocampal pyramidal cells. J Neurosci. 1984;4:251–264. - PMC - PubMed
    1. Amaral D, Lavenex P. Hippocampal Neuroanatomy. In: Andersen P, Morris M, Amaral D, Bliss T, O'Keefe J, editors. The Hippocampus Book. New York: Oxford University Press; 2007.
    1. Ances BM, Leontiev O, Perthen JE, Liang C, Lansing AE, Buxton RB. Regional differences in the coupling of cerebral blood flow and oxygen metabolism changes in response to activation: implications for BOLD-fMRI. Neuroimage. 2008;39:1510–1521. - PMC - PubMed
    1. Angenstein F, Kammerer E, Scheich H. The BOLD response in the rat hippocampus depends rather on local processing of signals than on the input or output activity. A combined functional MRI and electrophysiological study. J Neurosci. 2009;29:2428–2439. - PMC - PubMed
    1. Attwell D, Laughlin SB. An energy budget for signaling in the grey matter of the brain. J Cereb Blood Flow Metab. 2001;21:1133–1145. - PubMed