Review
. 2010 Apr;1798(4):801-28.
doi: 10.1016/j.bbamem.2009.12.010. Epub 2009 Dec 22.

Overcoming rapid inactivation of lung surfactant: analogies between competitive adsorption and colloid stability

Affiliations
Review

Overcoming rapid inactivation of lung surfactant: analogies between competitive adsorption and colloid stability

Joseph A Zasadzinski et al. Biochim Biophys Acta. 2010 Apr.

Abstract

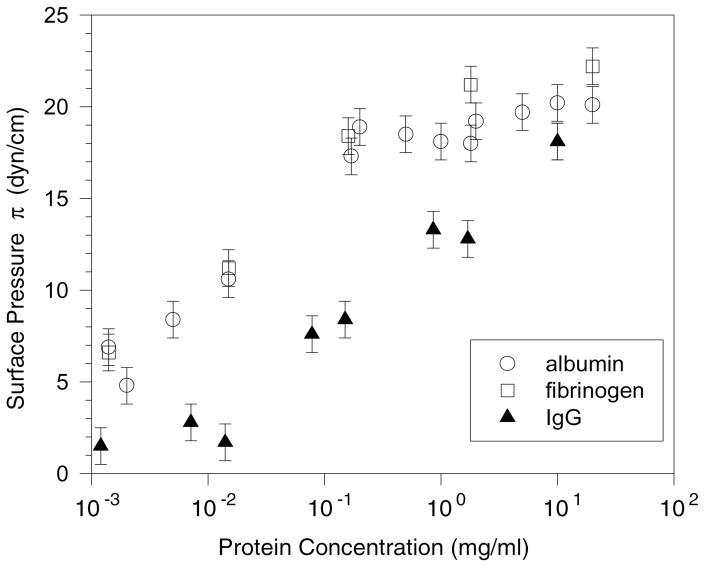
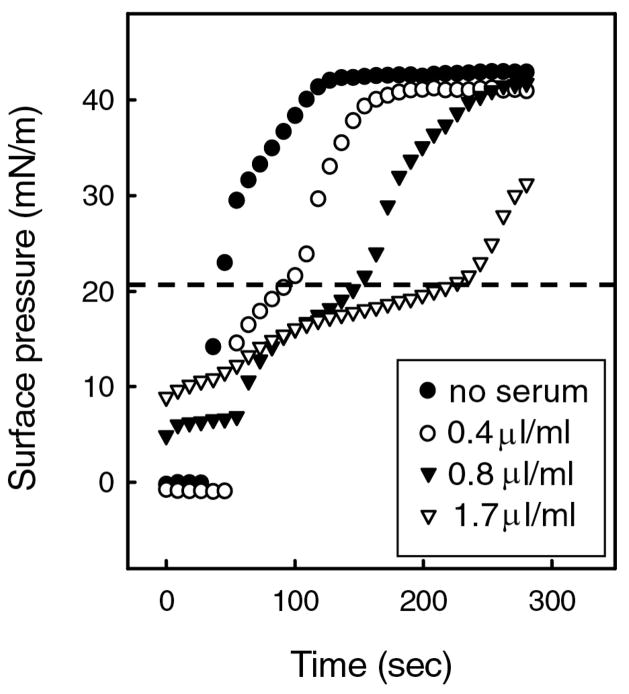
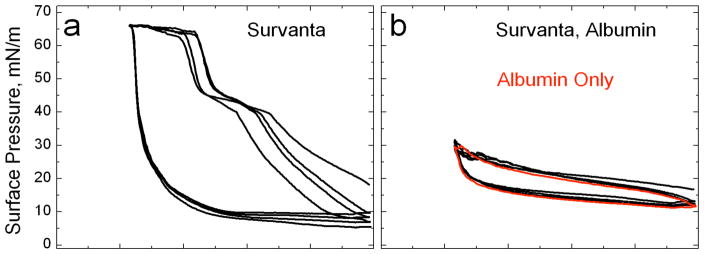
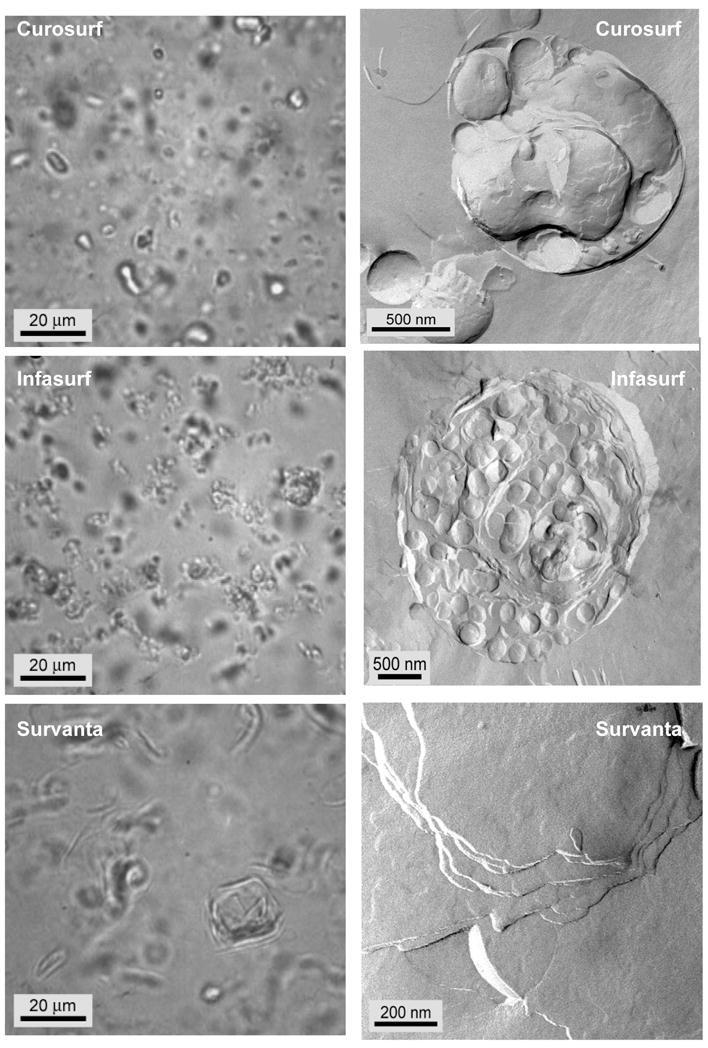
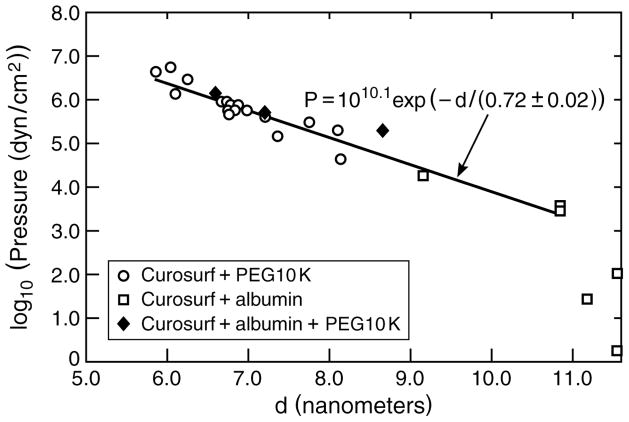
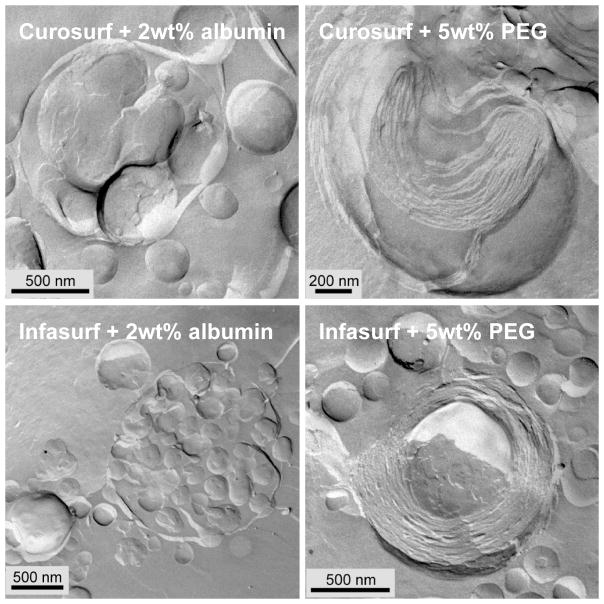
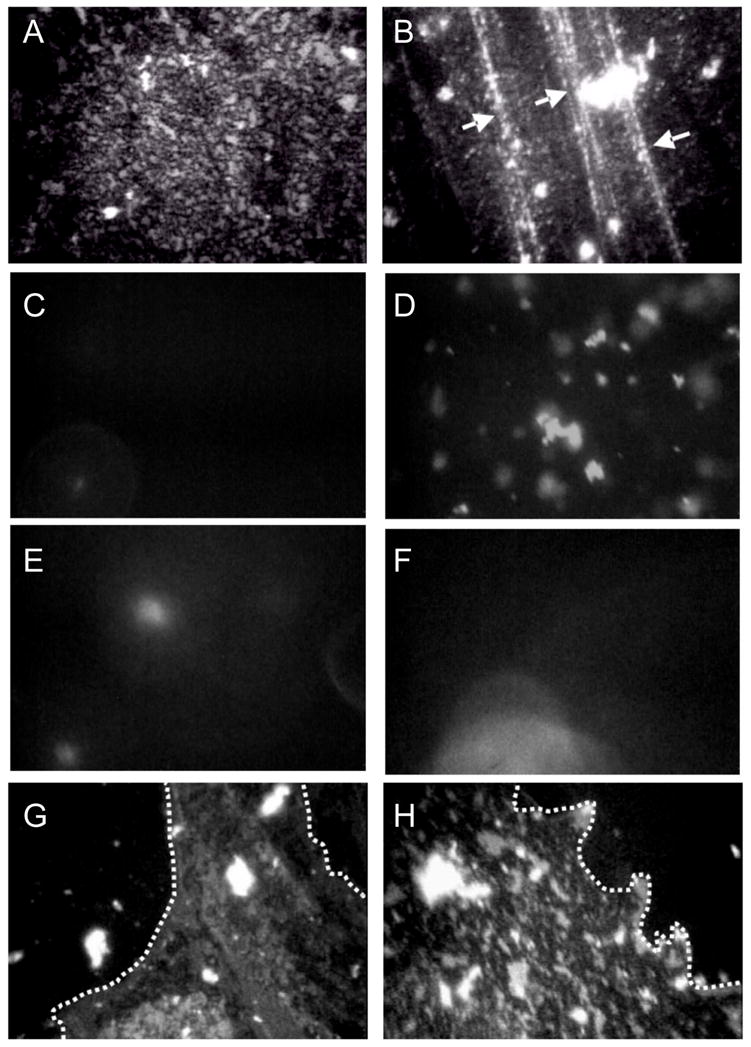
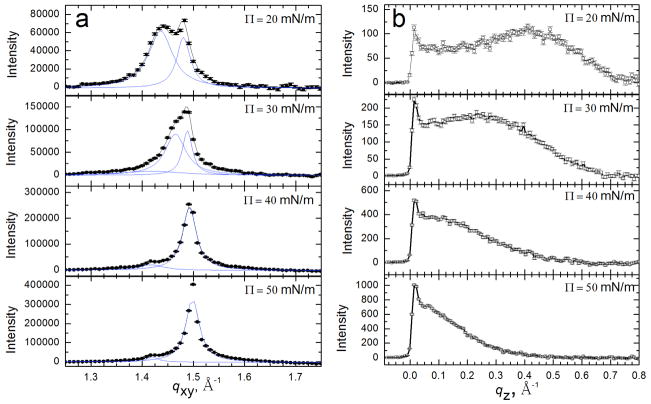
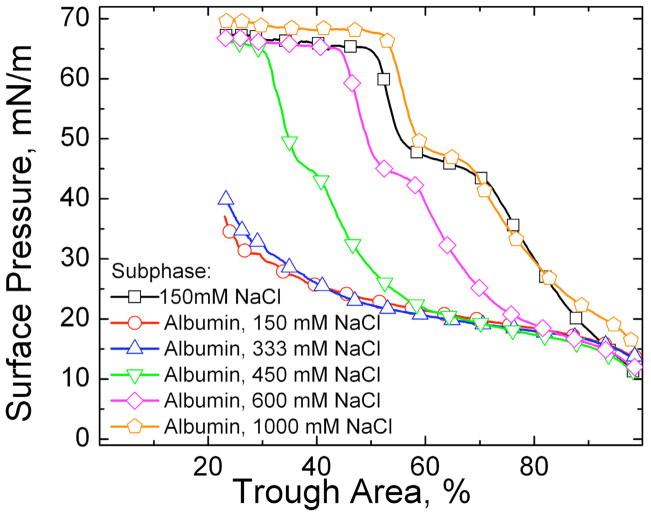
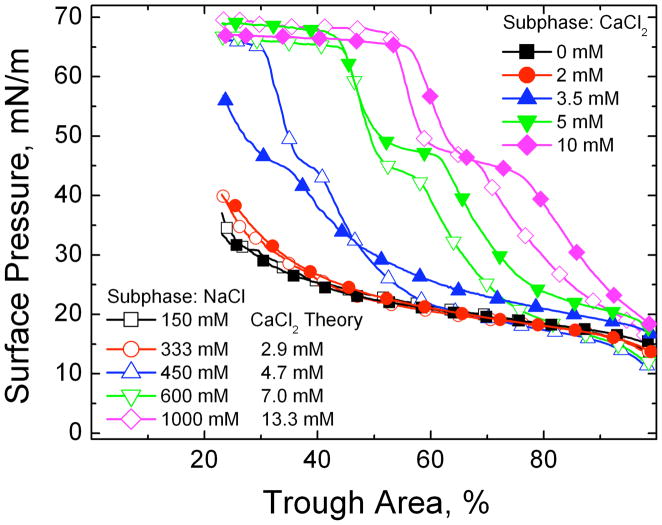
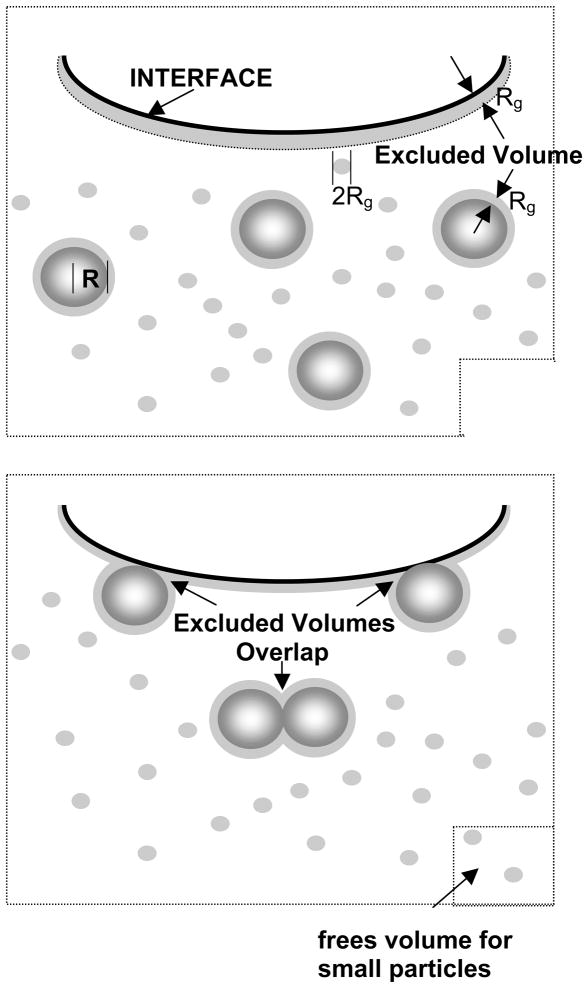
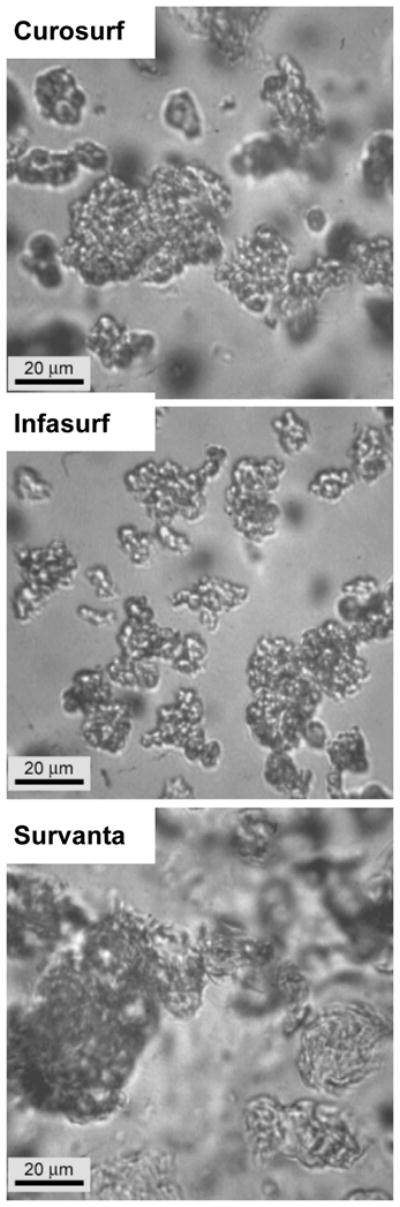
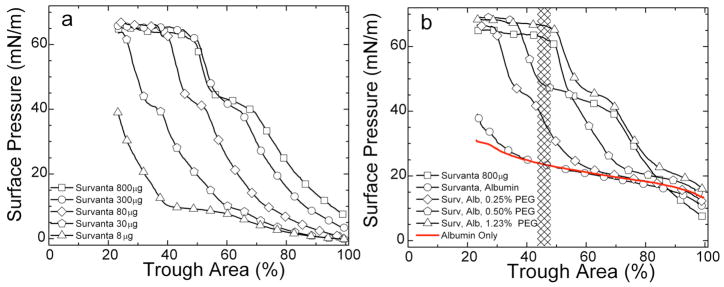
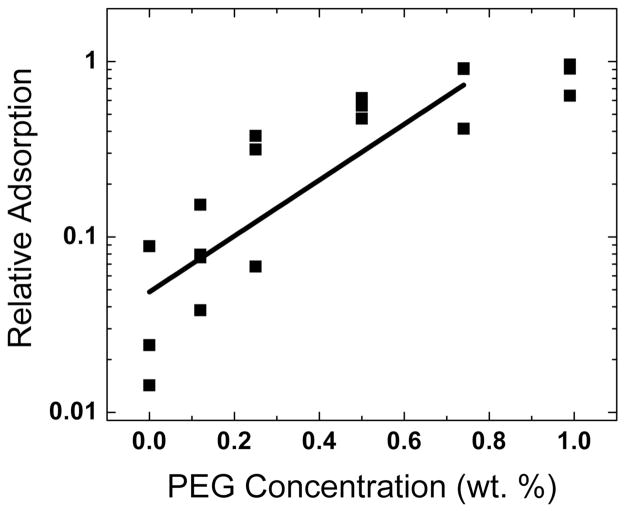
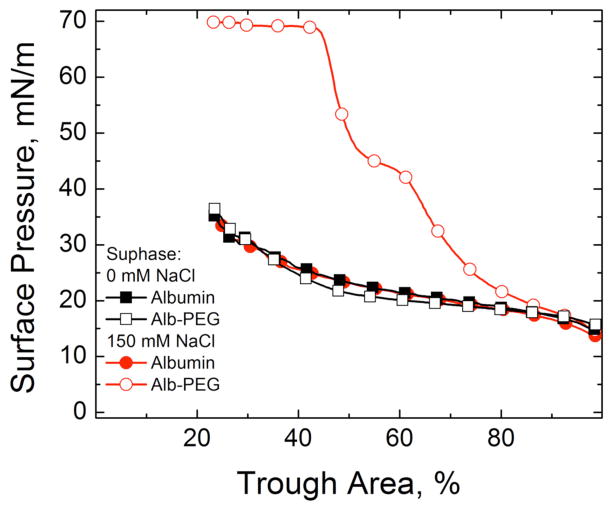
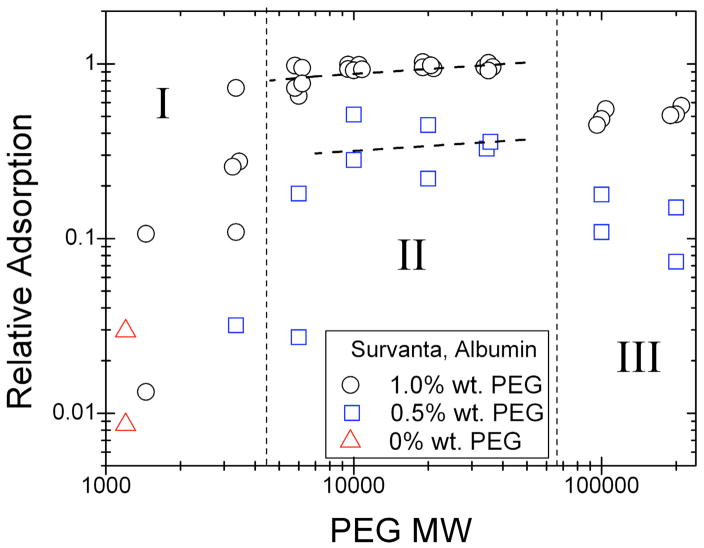
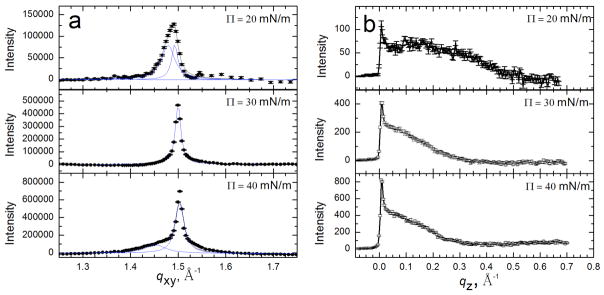
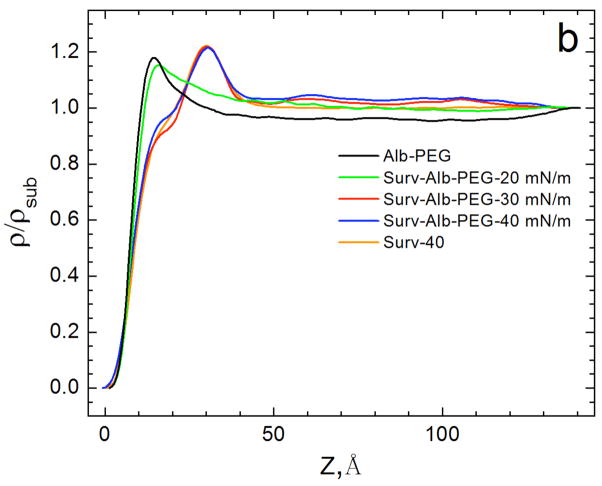
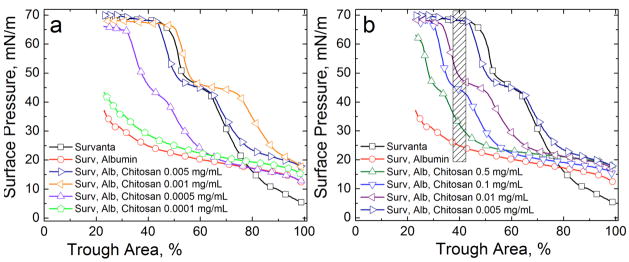
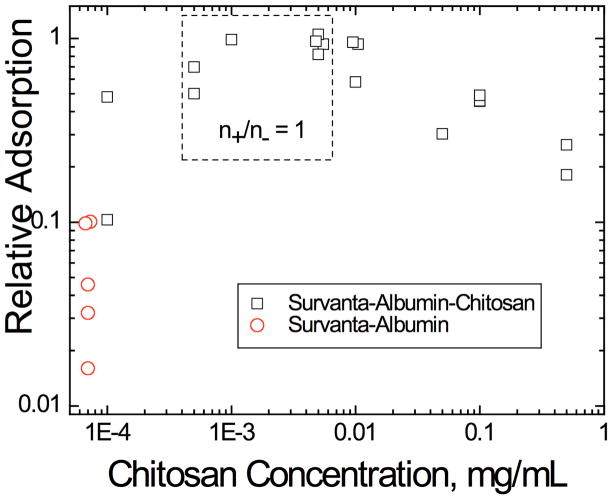
Lung surfactant (LS) is a mixture of lipids and proteins that line the alveolar air-liquid interface, lowering the interfacial tension to levels that make breathing possible. In acute respiratory distress syndrome (ARDS), inactivation of LS is believed to play an important role in the development and severity of the disease. This review examines the competitive adsorption of LS and surface-active contaminants, such as serum proteins, present in the alveolar fluids of ARDS patients, and how this competitive adsorption can cause normal amounts of otherwise normal LS to be ineffective in lowering the interfacial tension. LS and serum proteins compete for the air-water interface when both are present in solution either in the alveolar fluids or in a Langmuir trough. Equilibrium favors LS as it has the lower equilibrium surface pressure, but the smaller proteins are kinetically favored over multi-micron LS bilayer aggregates by faster diffusion. If albumin reaches the interface, it creates an energy barrier to subsequent LS adsorption that slows or prevents the adsorption of the necessary amounts of LS required to lower surface tension. This process can be understood in terms of classic colloid stability theory in which an energy barrier to diffusion stabilizes colloidal suspensions against aggregation. This analogy provides qualitative and quantitative predictions regarding the origin of surfactant inactivation. An important corollary is that any additive that promotes colloid coagulation, such as increased electrolyte concentration, multivalent ions, hydrophilic non-adsorbing polymers such as PEG, dextran, etc. added to LS, or polyelectrolytes such as chitosan, also promotes LS adsorption in the presence of serum proteins and helps reverse surfactant inactivation. The theory provides quantitative tools to determine the optimal concentration of these additives and suggests that multiple additives may have a synergistic effect. A variety of physical and chemical techniques including isotherms, fluorescence microscopy, electron microscopy and X-ray diffraction show that LS adsorption is enhanced by this mechanism without substantially altering the structure or properties of the LS monolayer.

Keywords: Debye length; albumin; charge reversal; chitosan; depletion attraction; inhibition; polyethylene glycol.


Figures

Figure 1
Figure 1
Surface pressure π vs. protein concentration for bovine albumin, fibrinogen and IgG at 25 ± 1 C in buffered saline; this behavior is consistent with the serum proteins forming Gibbs-type monolayers. Fibrinogen and albumin exert a higher surface pressure than IgG at all concentrations measured. Fibrinogen and albumin reach their saturation concentrations at ~ .1 – 1.0 mg/ml, while the IgG concentration at saturation is ~ 10 mg/ml. The lower the concentration required to reach the saturation concentration, the more surface-active is the molecule and the greater is its ability to inactivate lung surfactant. However, the saturation surface pressure, Πsat, never goes much beyond 20 – 25 mN/m for all surface active serum proteins [91] and the surface pressure does not increase significantly on compression of the interface [74].
Figure 2
Figure 2
Fixed amounts of the clinical lung surfactant Curosurf deposited within a buffered subphase (24°C) containing increasing concentrations of human serum. ● no serum; ○ 0.4 μl serum/mL buffer; ▼; 0.8μl serum/mL buffer; ▽ 1.7 μl serum/mL buffer. The rate of increase in surface pressure after addition of Curosurf decreased below ~ 20 mN/m (dotted line), and was proportional to the serum concentration. Above ~ 20 mN/m, the rate of increase in surface pressure was similar to that of the serum-free surfaces. The critical surface pressure at which the rates change is roughly equal to the equilibrium surface pressure, Πeq, of a subphase containing serum, ~ 20 mN/m (see Figure 1) [74, 91] The data suggests that as the surfactant adsorbs, the surfactant compresses the serum components at the interface up to Πeq, at which the serum components are squeezed-out from the interface back into the subphase. At higher serum concentrations in the subphase, more serum is adsorbed to the interface (Fig.1) and it takes longer for surfactant to adsorb and raise the surface pressure to Πsat. This decrease in the rate of adsorption with serum proteins can cause insufficient surfactant to adsorb to the interface in the time available during respiration Figure adapted from [13].
Figure 3
Figure 3
(a) Normal isotherms of Survanta, a clinical lung surfactant, on a buffered saline subphase. (b) Survanta on a 2 mg/ml albumin subphase. The Survanta plus albumin isotherm is indistinguishable from the albumin only isotherm (red). Only albumin is adsorbed to the interface under these conditions.
Figure 4
Figure 4. Optical phase contrast (left column) and freeze-fracture electron (right column) microscopy images of Curosurf (A, B), Infasurf (C, D) and Survanta (E, F)
A, C, E: The optical images show that all of the clinical surfactants consist of dispersed, small aggregates, with Survanta being the largest. B. Individual Curosurf aggregates are multilamellar and typically had some void space between bilayers and “pockets” of water within the aggregate. This is consistent with the small angle X-ray scattering that showed broad reflections indicative of poor correlations between the bilayers. D. Infasurf aggregates had a multicompartment bilayer structure with densely packed interior vesicles and large water pockets. The structures are similar to vesosomes, a vesicle in vesicle drug delivery vehicle [–117, 216]. F. Survanta aggregates were typically too large to be imaged as individual particles in TEM. Here we show the multilamellar stacks of well-ordered bilayers within the larger aggregates. There are no water pockets within the Survanta particles. The degree of organization of the aggregates scaled with the fraction of saturated phospholipids and fatty acids, with Survanta being the most ordered and having the most saturated lipids, and Infasurf having the least ordered aggregates, with the highest unsaturated lipid and cholesterol fraction (Figure adapted from [87]).
Figure 5
Figure 5
Bilayer d-spacing measured by small angle X-ray scattering from dispersions of Curosurf, Curosurf plus albumin and Curosurf plus albumin and 10 KDa PEG polymer as a function of the osmotic pressure of polymer or polymer plus albumin. For osmotic pressures greater than 103 dynes/cm2, the d-spacing decreases exponentially with increasing osmotic pressure with a decay length of 0.72 nm, which is nearly identical to the calculated Debye length of the solvent, κ−1 = 0.77 nm, confirming that the bilayers interaction is dominated by the electrostatic double-layer repulsion [133, 134]. For comparison to Figs. 4, 6, the osmotic pressure of 2 wt% albumin is < 103 dynes/cm2 and the osmotic pressure of 5 wt% 10 kDa PEG is ~ 106 dynes/cm2. The albumin and polymer act primarily as osmotic agents that dehydrate the bilayers, confirming that albumin and polymer do not adsorb to or penetrate the surfactant aggregates. Figure adapted from [87].
Figure 6
Figure 6
Freeze-fracture TEM images of Curosurf (top row) and Infasurf (bottom row) aggregates in a buffer containing 2 wt% albumin (left) or 5 wt% 10 kDa PEG (right). 2 wt% albumin does not appreciably alter the aggregate morphology (compare to Fig. 4), while it is more than sufficient to prevent LS adsorption. 5 wt% 10 kDa PEG causes the bilayer spacing in both Curosurf and Infasurf aggregates to decrease (see Fig. 5) and eliminates the water-filled void spaces within the aggregates. The bilayers were more ordered after exposure to PEG (compare to Fig. 4). For Infasurf in 5 wt% 10 kDa PEG, instead of the vesicle within vesicle structure common when there was no PEG (Fig. 4), the aggregates were much more compact with concentric, parallel bilayers in onion-like structures [16, 56]. Figure adapted from [87]. These changes are consistent with PEG not being capable of crossing the bilayers and acting as an osmotic dehydrating agent.
Figure 7
Figure 7
Fluorescence images of 800 μg Survanta spread at varying subphase compositions. Images are 180 μm by 250 μm. The left column is for each subphase composition at Π = 18 mN/m (a, c, e, g) and the right column is for each subphase at the maximum surface pressure reached during the cycle (66,40,31,38 mN/m, respectively for b, d, f, h). Row 1-Survanta on a clean, buffered subphase. (a) shows the mottled texture typical of a phase separated lipid/protein monolayer. The mottled texture is found at all surface pressures from 0 to collapse. (b) Arrows denote cracks where material is forced from the interface at the collapse plateau at 66 mN/m. Row 2-Survanta on buffer containing 2 mg/mL albumin. (c) At low surface pressure, no fluorescence is visible showing that the albumin prevents Survanta from adsorbing to the interface. (d) After several expansion and compression cycles (see Fig. 1b), Survanta comes close to the interface, but does not spread due to the albumin film at the interface. (Compare to e – h) Row 3- (e) During the first cycle for Survanta spread on buffer containing 2 mg/mL albumin and 0.12% wt. PEG, small areas of the interface are starting to become covered with Survanta. (f) The Survanta monolayer begins to displace the albumin (arrow). Row 4- (g) By the third expansion-compression cycle for Survanta spread on buffer containing 2 mg/mL albumin and 0.12% wt. PEG larger areas have a morphology similar to Survanta on a clean interface (Row 1, a,b) in coexistence with areas similar to albumin (Row 2, c, d). The dotted white lines denote the borders between the Survanta and albumin regions. 0.12 wt% PEG is not sufficient to allow for sufficient Survanta adsorption to completely displace the albumin (See Fig. 3). For ~ 1 wt% PEG, the images are identical to Row 1 for all cycles (not shown) Figure adapted from [83].
Figure 8
Figure 8
Bragg peaks (a) and Bragg rods (b) from GIXD scans of 200 μg Survanta spread onto a saline buffer subphase. (a) Bragg peaks at 20–50 mN/m. The points indicate instrument data, the black curve is the overall fit and the blue curves are fits of the individual peaks. The packing changes from distorted hexagonal to hexagonal at 40 mN/m (see schematic in Table 1). A second unknown phase is visible at 1.42 Å−1 at higher surface pressures. (b) Bragg rods at 20–50 mN/m. The local maximum of the Bragg rod profile shifts left with increasing surface pressure indicating a reduction in tilt of the molecules relative to the normal; the molecules are normal to the interface for Π ≥ 40 mN/m as indicated by the lack of a local maximum for z > 0. The lattice spacings and details of the molecular ordering are given in Table 1. Figure adapted from [97].
Figure 9
Figure 9
The electron density profiles calculated from X-ray reflectivity data normalized by the subphase electron density, for 200 μg Survanta spread on the control subphase. Increasing Z moves from the air (Z=0) through the interface and into the subphase. With increasing surface pressure, the density of the headgroup maximum increases, the width of the headgroup region decreases and the location of the headgroup maximum shifts right, consistent with the GIXD data in Fig. 8 that shows a steady decrease in the molecular tilt with increasing surface pressure Figure adapted from [97].
Figure 10
Figure 10
Bragg peaks (a) and Bragg rods (b) from GIXD scans of 600 μg Survanta spread onto a saline buffer subphase containing 2 mg/mL albumin. (a) Bragg Peaks at 20–30 mN/m. The points indicate the diffraction data, the black curve is the overall fit and the blue curves are fits of the individual peaks. The first two panels show different regions of the film at the same surface pressure. Surface pressures higher than 28 mN/m cannot be sustained due to the presence of albumin. The distorted hexagonal lattice is slightly shifted compared to Survanta on a saline buffered subphase (See Table 1 for details). The last panel shows a GIXD scan at 20 mN/m after two additional cycles; the Survanta peaks are no longer present. (b) Bragg rods at 20–28 mN/m for scans containing Survanta peaks. At each surface pressure, a local maximum occurs for z > 0 and at a given surface pressure the molecular tilt is somewhat greater than on the control subphase Figure adapted from [97].
Figure 11
Figure 11
The electron density profiles, normalized by the subphase electron density from X-ray reflectivity measurements for 600 μg Survanta spread on a saline buffer subphase containing 2 mg/mL albumin. No Survanta is present for the albumin-only subphase data. Region 1 and Region 2 are the same areas as the GIXD data in Fig. 10. For Survanta-albumin mixtures at 20 mN/m, the electron density profile is similar to albumin for both Region 1 and Region 2, while for 28 mN/m, the electron density profile is similar to Survanta (Fig. 9). Figure adapted from [97].
Figure 12
Figure 12
Cyclic isotherms of Survanta and albumin on a buffered subphase (0.2 mM NaHCO3 and pH=7) containing varying NaCl and CaCl2 concentrations. (a) 800 μg Survanta deposited onto a subphase containing varying NaCl concentrations. For all plots, the solid symbol denotes the surface pressure after adsorption before beginning the first compression cycle. The first compression, first expansion and second compression are shown for all three isotherms. □ 1000 mM NaCl subphase; ○ 150 mM NaCl subphase; △ 0 mM NaCl subphase. Increasing NaCl concentration increases the equilibrium surface pressure, the minimum surface pressure on expansion and promotes re-adsorption of collapsed material. (b) Fourth cycle isotherms of 2 mg/mL albumin on a buffered subphase (0.2 mM NaHCO3 and pH=7) containing varying concentrations of electrolytes. No Survanta has been deposited. □ 1000 mM NaCl subphase; ○ 150 mM NaCl subphase; △ 0 mM NaCl subphase; ▽ 150 mM NaCl, 20 mM CaCl2 subphase. The albumin isotherm is independent of the subphase electrolyte concentration indicating that the albumin adsorption and surface activity are unchanged over the range studied.
Figure 13
Figure 13
Fourth cycle compression isotherms of 800 μg Survanta on a buffered subphase (0.2 mM NaHCO3 and pH=7) containing varying NaCl concentrations and/or albumin (2 mg/mL when present). □ Survanta on a 150 mM NaCl subphase; ○ Survanta-albumin on a 150 mM NaCl subphase; △ Survanta-albumin on a 333 mM NaCl subphase; ▽ Survanta-albumin on a 450 mM NaCl subphase; ◇ Survanta-albumin on a 600 mM NaCl subphase; ⬠ Survanta-albumin on a 1000 mM NaCl subphase. A subphase containing 1000 mM NaCl is necessary to completely reverse the albumin inhibition and restore surfactant adsorption.
Figure 14
Figure 14
The fourth cycle compression isotherms of 800 μg lipid dispersion on a buffered saline subphase (0.2 mM NaHCO3 and pH=7) containing 2 mg/mL albumin and varying electrolyte concentrations. □ 150 mM NaCl subphase; ○ 333 mM NaCl subphase; △ 450 mM NaCl subphase; ▽ 600 mM NaCl subphase; ◇ 1000 mM NaCl; ■ 0 mM CaCl2, 150 mM NaCl subphase; ● 2 mM CaCl2, 150 mM NaCl subphase; ▲ 3.5 mM CaCl2, 150 mM NaCl subphase; ▼; 5 mM CaCl2, ◆ 150 mM NaCl subphase; 10 mM CaCl2, 150 mM NaCl subphase. For each NaCl concentration, the theoretical CaCl2 concentration according to the Schulze-Hardy/DLVO scaling (Eqn. 13) is given. The agreement between theory and experiment is excellent. Figure adapted from [79].
Figure 15
Figure 15
Origin of depletion forces in a binary sphere mixture. (Top) The centers of the small spheres are excluded from the hatched regions within one small sphere radius (Rg) of the larger spheres (radius R) or the interface. (Bottom) When the larger spheres move to the interface or toward each other, the hatched regions overlap, and the total volume accessible to the small spheres increases by this amount times the number of large spheres (total increase in volume in the bottom right-hand corner). The increase in the volume accessible to the polymer increases the entropy of the system, resulting in a net “depletion” force pushing the large spheres toward the interface or each other. Figure adapted from [42].
Figure 16
Figure 16
Surfactant particles flocculate on addition of 5 wt% 10 kDa PEG in addition to increased adsorption to the interface. Curosurf, Infasurf and Survanta form large, 20 – 100 micron size loose flocs due to the depletion attraction (compare to Fig. 6) [42]. The flocs can be redispersed by stirring or shaking, indicative of the weak, short-ranged depletion attraction holding them together. Hyaluronic acid and dextran also flocculate surfactant aggregates [201], consistent with a depletion attraction overcoming the electrostatic repulsion due to the anionic lipids present in most lung surfactants. The depletion attraction between surfactant particles is only half that between the particles and the interface, so proportionally more polymer is required to flocculate the particles than necessary to enhance adsorption to the interface [194]. Figure adapted from[42].
Figure 17
Figure 17. Fourth compression cycle isotherms of increasing concentrations of Survanta on a clean buffer subphase (a) and 800 μg Survanta on subphases containing 2 mg/ml albumin with increasing PEG concentrations (b)
(a) △ 8 μg Survanta; ⬠ 30 μg Survanta; ◇ 80 μg Survanta; ○ 300 μg Survanta; □ 800 μg Survanta; At a given surface pressure, the isotherms are translated essentially unchanged from low trough area to high trough area with increasing Survanta concentration (note the characteristic shoulder at ~ 40 mN/m and the collapse plateau at ~ 65 mN/m). This shows that Survanta adsorption increases with increasing concentration as predicted by Eqn. 12. The interface becomes saturated for concentrations greater than about 300 μg; the 800 μg isotherm is not displaced significantly to higher trough areas. (b) □ Survanta on saline buffer subphase with no albumin; ○ Survanta-albumin; ◇ Survanta-albumin-0.25 wt. % PEG; ⬠ Survanta-albumin-0.50 wt. % PEG; △ Survanta-albumin-1.2 wt. % PEG. The red curve shows the surface pressure for the albumin subphase with no Survanta or PEG. Comparing to (a) shows that albumin in the subphase produces the same effect as decreasing the Survanta concentration from 800 μg to about 8 μg. Adding increasing amounts of PEG to the subphase shifts the isotherms to higher trough areas, the same effect as increasing the Survanta concentration in (a). The shaded area denotes the trough area over which the surface pressure was averaged for each PEG concentration to obtain the relative surfactant adsorption plotted in Fig. 18. Figure adapted from [83].
Figure 18
Figure 18
The relative adsorption (RA) is the difference between the sample surface pressure (Π) and the surface pressure of the albumin only isotherm (ΠAlb, red curve in Fig. 3b), divided by the difference between the surface pressure for the saturated isotherm (> 1% PEG in Fig. 17b) and ΠAlb, RA=ΠΠAlbΠsaturatedΠAlb|A0. All surface pressures were evaluated by averaging over the same trough area denoted by the shaded area in Figure 17b. The solid line is a fit to the data showing the exponential dependence of RA on the polymer concentration as predicted by Eqns. 15–16, consistent with the depletion attraction lowering the DLVO energy barrier to surfactant adsorption. Figure adapted from [83].
Figure 19
Figure 19
Fourth cycle compression isotherms of 800 μg lipid dispersion on a buffered subphase (0.2 mM NaHCO3 and pH=7) containing 2 mg/mL albumin, 10 mg/mL 10 kDa PEG and varying NaCl concentrations. Filled symbols denote subphases containing albumin and NaCl while open symbols denote subphases containing albumin, NaCl and PEG. ■ 0 mM NaCl-albumin subphase; □ 0 mM NaCl- albumin-PEG subphase; ● 150 mM NaCl-albumin-subphase; ○ 150 mM NaCl-albumin-PEG subphase. Adding PEG restores the characteristic shoulder and collapse plateau of the Survanta with 150 mM NaCl in the subphase, but the same amount of PEG added to a 0 mM NaCl subphase does not alter the albumin-like isotherm. The range of the depletion attraction induced by PEG is twice the radius of gyration of the polymer, about 9 nm for 10 kDa PEG, which is less than the Debye length of 13 nm for the 0 mM NaCl subphase. For 150 mM NaCl, the Debye length is 1 nm, so the PEG induced depletion attraction has sufficient range to lower the repulsive potential. Figure adapted from [79].
Figure 20
Figure 20
Relative adsorption (RA, See Fig. 18) of 800 μg Survanta on subphases containing 2 mg/mL albumin at varying PEG molecular weights and concentrations. ○ 1% wt. PEG; □ 0.5% wt. PEG; △ 0% wt. PEG which has been plotted for comparison purposes. Region I (PEG 1.45 – 3.35 kDa) corresponds to minimal reversal of surfactant adsorption inhibition, Region II (PEG 6 – 35 kDa) corresponds to complete reversal of adsorption inhibition and Region III (PEG 100 – 200 kDa) corresponds to partial reversal of adsorption inhibition. The dashed line, where RA depends on the MW0.1, is a good fit to the PEG 1% wt. data in Region II, consistent with the depletion attraction lowering the energy barrier to surfactant adsorption. Figure adapted from [84].
Figure 21
Figure 21
Bragg peaks and rods from GIXD of 600 μg Survanta spread onto a subphase containing 2 mg/mL albumin and 5% wt. PEG. (a) Bragg Peaks at 20–40 mN/m. The packing changes from distorted hexagonal to hexagonal at a lower surface pressure than Survanta on the control subphase. (b) Bragg rods at 20–40 mN/m. Zero tilt occurs at a lower surface pressure than Survanta on the control subphase. PEG in the subphase compacts the Survanta lattice and eliminates the molecular tilt at a lower surface pressure compared to control subphase. It may be that PEG induces a lateral “depletion attraction” within the film, as well as inducing the depletion attraction that forces Survanta to the interface. However, the overall phase progression, lattice spacings and tilt were little changed from Survanta on a saline subphase (Fig. 8), showing that the primary effect of adding PEG is to induce a depletion attraction that enhances surfactant adsorption. Figure adapted from [97].
Figure 22
Figure 22
The electron density profiles, normalized by the subphase electron density, determined by X-ray reflectivity for 600 μg Survanta spread on a subphase containing 2 mg/mL albumin and 5% wt. PEG. No Survanta was present for the albumin-PEG subphase data. The albumin-PEG subphase has an electron density profile similar to albumin (Fig. 11), with a maximum electron density of ρ/ρsub = 1.18 at Z = 15 Å. However, the albumin-PEG subphase profile decreases more quickly than albumin and reaches a minimum value of 0.95, suggesting a PEG depletion layer. At 20 mN/m, the electron density profile is similar to albumin, while for 30 and 40 mN/m; the electron density is similar to Survanta, indicating Survanta has displaced the albumin. The electron density profile of 200 μg Survanta on the control subphase at 40 mN/m is shown for comparison. The measured electron density is consistent with a PEG “depletion layer” at the interface, which validates one of the major requirements of the depletion attraction. Figure adapted from [97].
Figure 23
Figure 23
Fourth cycle compression isotherms of 800 μg Survanta on a saline buffered subphase containing albumin (2 mg/mL when present) and the stated chitosan concentrations. (a) □ Survanta; ○ Survanta-albumin; ▷ Survanta-albumin with 0.005 mg/mL chitosan, ◁ Survanta-albumin with 0.001 mg/mL chitosan; △ Survanta-albumin with 0.0005 mg/mL chitosan; ⬠ Survanta-albumin with 0.0001 mg/mL chitosan. In this concentration regime, increasing chitosan concentration yields increasing surfactant adsorption. Charge neutralization of the Survanta and albumin is reached between 0.0005–0.005 mg/mL chitosan [80]. Note that for .001 mg/ml chitosan, more Survanta adsorbs (isotherm shifted to larger trough areas) than the control Survanta on a clean subphase. Figure adapted from [80]. (b) □ Survanta; ○ Survanta-albumin; △ Survanta-albumin-chitosan 0.5 mg/mL, ▽ Survanta-albumin-chitosan 0.1 mg/mL; ◁ Survanta-albumin-chitosan 0.01 mg/mL; ▷ Survanta-albumin-chitosan 0.005 mg/mL. For chitosan concentrations greater than that necessary for charge neutralization (Fig. 24), surfactant adsorption decreased. The shaded area denotes the trough area over which the surface pressure was averaged for each chitosan concentration to obtain the surfactant relative adsorption plotted in Fig. 24. Figure adapted from [80].
Figure 24
Figure 24
Relative adsorption (RA) of 800 μg Survanta on subphases containing 2 mg/mL albumin at varying chitosan concentrations. □ Survanta-albumin-chitosan; ○ Survanta-albumin, which as been plotted at a chitosan concentration of 7×10⁻⁵ mg/mL for comparison purposes. All surface pressures were evaluated by averaging over the same trough area, A0, denoted by the shaded area in Fig. 23. The relative adsorption increases with chitosan concentration to an optimum value of RA ~ 1 at .001 – 0.005 mg/mL chitosan and then decreases with subsequent increases in chitosan concentration. The dashed box indicates the calculated chitosan concentration range where n+/n = 1 (0.0005–0.005 mg/mL) [80]. The optimum RA occurs in this chitosan concentration range consistent with a chitosan neutralizing the negative surface charge on the albumin and surfactant, thereby eliminating the electrostatic energy barrier to surfactant adsorption. Higher chitosan concentrations above n+/n = 1 lead to charge reversal as excess chitosan adsorbs to the albumin and surfactant, leading to a net positive charge in the double layer and a restored energy barrier to adsorption (Eqn. 14). Figure adapted from [80].

Similar articles

Cited by

References

    1. Bastacky J, Lee CY, Goerke J, Koushafar H, Yager D, Speed TP, Chen Y, Clements JA. Alveolar lining layer is thin and continuous: low temperature scanning electron microscopy of rat lung. J Applied Physiology. 1995;79:1615–1628. - PubMed
    1. Clements JA, Avery ME. Lung surfactant and neonatal respiratory distress syndrome. American Journal of Respiratory and Critical Care Medicine. 1998;157:S59–S66. - PubMed
    1. Notter R. Lung surfactant: basic science and clinical applications. Marcel Dekker; New York: 2000.
    1. Perez-Gil J. Structure of pulmonary surfactant membranes and films: the role of proteins and lipid-protein interactions. Biochimica et Biophysica acta (BBA)-Biomembranes. 2008;1778:1676–1695. - PubMed
    1. Zasadzinski JA, Ding J, Warriner HE, Bringezu F, Waring AJ. The physics and physiology of lung surfactants. Current Opinion in Colloid & Interface Science. 2001;6:506–513.

Publication types