. 2010 Mar;9(3):457-70.
doi: 10.1074/mcp.M900429-MCP200. Epub 2009 Dec 21.

A quantitative proteomics analysis of subcellular proteome localization and changes induced by DNA damage

Affiliations

A quantitative proteomics analysis of subcellular proteome localization and changes induced by DNA damage

François-Michel Boisvert et al. Mol Cell Proteomics. 2010 Mar.

Abstract

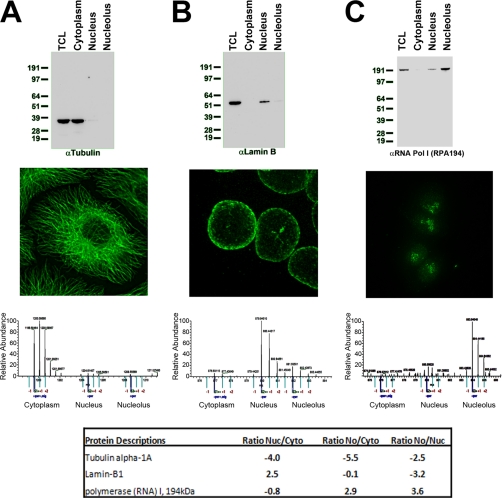
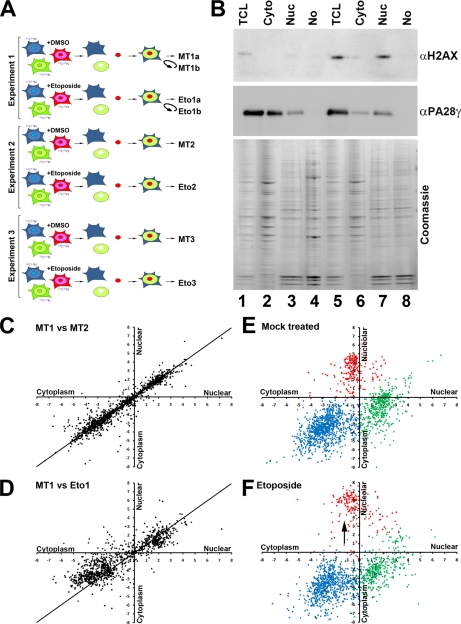
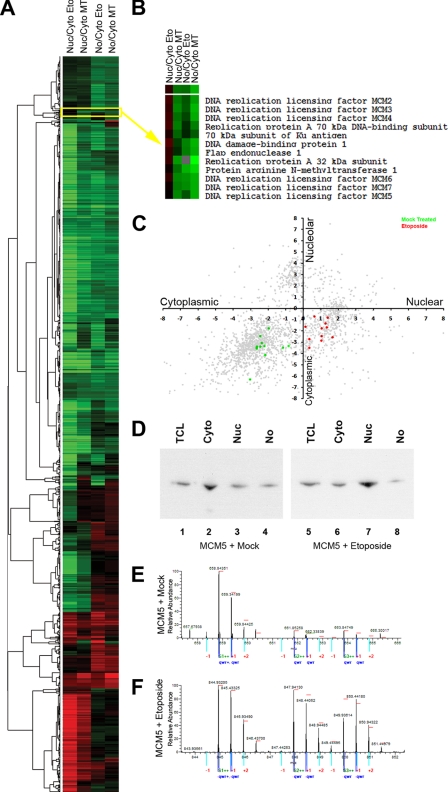
A major challenge in cell biology is to identify the subcellular distribution of proteins within cells and to characterize how protein localization changes under different cell growth conditions and in response to stress and other external signals. Protein localization is usually determined either by microscopy or by using cell fractionation combined with protein blotting techniques. Both these approaches are intrinsically low throughput and limited to the analysis of known components. Here we use mass spectrometry-based proteomics to provide an unbiased, quantitative, and high throughput approach for measuring the subcellular distribution of the proteome, termed "spatial proteomics." The spatial proteomics method analyzes a whole cell extract created by recombining differentially labeled subcellular fractions derived from cells in which proteins have been mass-labeled with heavy isotopes. This was used here to measure the relative distribution between cytoplasm, nucleus, and nucleolus of over 2,000 proteins in HCT116 cells. The data show that, at steady state, the proteome is predominantly partitioned into specific subcellular locations with only a minor subset of proteins equally distributed between two or more compartments. Spatial proteomics also facilitates a proteome-wide comparison of changes in protein localization in response to a wide range of physiological and experimental perturbations, shown here by characterizing dynamic changes in protein localization elicited during the cellular response to DNA damage following treatment of HCT116 cells with etoposide. DNA damage was found to cause dissociation of the proteasome from inhibitory proteins and assembly chaperones in the cytoplasm and relocation to associate with proteasome activators in the nucleus.


Figures

Fig. 1.
Fig. 1.
A, human colon carcinoma HCT116 cells were grown in DMEM containing either the normal light isotopes of carbon and nitrogen (i.e. 12C14N) (light), l-[13C6,14N4]arginine and l-[2H4]lysine (medium), or l-[13C6,15N4]arginine and l-[13C6,15N2]lysine (heavy). Separate cytoplasmic, nuclear, and nucleolar fractions were isolated from each labeled cell population. B, equal amounts of total protein from each fraction were then recombined to recreate a whole cell extract but with Cyto, Nuc, and No arising from cells with different isotope labels. The recombined whole cell extract mixture was solubilized with loading buffer; proteins were separated using SDS-PAGE; and the resulting gel was cut into eight equal pieces, trypsin-digested, and analyzed by LC-MS/MS using an LTQ Orbitrap. Triplicate fractions and LC-MS/MS resulted in a proteome of 2,536 proteins.
Fig. 2.
Fig. 2.
Equal amounts (5 μg) of extract from total cell lysate (TCL) or from cytoplasmic, nuclear, or nucleolar fractions of HCT116 cells were separated by SDS-PAGE and transferred to nitrocellulose, and Western blotting was performed using antibodies recognizing α-tubulin (A), lamin B (B), or RPA194 (C). Alternatively, HCT116 cells were grown on coverslips, fixed, and processed for fluorescence microscopy using the same antibodies used for Western blotting. An example of a spectrum from each of the proteins derived from the spatial proteomics mass spectrometry run is also shown. The table shows the ratios of enrichment of Nuc/Cyto, No/Cyto, and No/Nuc.
Fig. 3.
Fig. 3.
A, hierarchical clustering was performed using the localization ratios (a) No/Nuc, (b) No/Cyto, and (c) Nuc/Cyto and represented as a tree. In each case, high ratios are shown in red, low ratios are in green, and a 1:1 ratio is in black. B, visualization of the spatial proteomics data by graphical representation, plotting the log base 2 nuclear/cytoplasmic ratio on the x axis and log base 2 nucleolar/cytoplasmic ratio on the y axis. C, the Sm proteins associated with the small nuclear RNP subunits of spliceosomes (blue), proteins associated with small nucleolar RNPs (snoRNPs; red), and protein subunits of the 26 S proteasome cluster (green) are shown as examples. PEP, posterior error probability.
Fig. 4.
Fig. 4.
Changes in protein localization were determined using spatial proteomics by comparing cells that were either MT or treated with 50 mm etoposide for 1 h. A, the entire experiment was repeated three times, and a whole cell extract recombining cytoplasmic, nuclear, and nucleolar fractions with separate light, medium, and heavy isotopes was prepared independently for the MT and Eto 1, 2, and 3 samples. Experiment 1 was run twice on the mass spectrometer (MT1a and -b and Eto1a and -b). B, HCT116 cells were either MT (lanes 1–4) or else exposed to a final concentration of 50 μm Eto (lanes 5–8) for 1 h, which caused the expected nuclear increase in phosphorylation of H2AX. C, scatter plot showing the comparison of the cytoplasmic versus nuclear distribution of MT1 and MT2. D, scatter plot showing the comparison of the cytoplasm versus nuclear distribution of MT1 versus Eto1. E, scatter plot showing the cytoplasm versus nuclear (x axis) and the cytoplasm versus nucleolar (y axis) distribution of proteins following mock treatment. F, scatter plot showing the cytoplasm versus nuclear (x axis) and the cytoplasm versus nucleolar (y axis) distribution of proteins following etoposide treatment. Cytoplasmic proteins are shown in blue, nuclear proteins are shown in green, and nucleolar proteins are shown in red. TCL, total cell lysate.
Fig. 5.
Fig. 5.
A, proteins with the gene ontology annotation proteolysis are plotted by their cytoplasmic/nuclear ratios versus their cytoplasmic/nucleolar ratio as either mock-treated (blue) or etoposide-treated (red). B, proteins with the gene ontology annotation ribosomal are plotted by their cytoplasmic/nuclear ratios versus their cytoplasmic/nucleolar ratio as either mock-treated (blue) or etoposide-treated (red). C, proteins PSMA1–7 and PSMB1–7 forming the 20 S proteasome are plotted by their cytoplasmic/nuclear ratios versus their cytoplasmic/nucleolar ratio as either mock-treated (blue) or etoposide-treated (red). D, proteins PSME1–3 forming the 11 S proteasome are plotted by their cytoplasmic/nuclear ratios versus their cytoplasmic/nucleolar ratio as either mock-treated (blue) or etoposide-treated (red). E, proteins PSMC1–6 and PSMD1–2 forming the base of the 19 S proteasome are plotted by their cytoplasmic/nuclear ratios versus their cytoplasmic/nucleolar ratio as either mock-treated (blue) or etoposide-treated (red). F, proteins PSMD3–14 forming the lid of the 19 S proteasome are plotted by their cytoplasmic/nuclear ratios versus their cytoplasmic/nucleolar ratio as either mock-treated (blue) or etoposide-treated (red). G, proteins showing the highest relocalization to the nucleus after etoposide and proteins showing no relocalization to the nucleus are displayed with the log base 2 ratio of their enrichment in each compartment.
Fig. 6.
Fig. 6.
A, protein complexes that showed a specific change in localization after etoposide treatment were clustered according to the log base 2 ratios and displayed as a heat map where green represents negative values and red represents positive values. B, a cluster containing the replication protein A complex proteins and the MCM complex proteins MCM2–7 all showed a similar specific change in their spatial proteome. C, the proteins displayed in B are plotted by their cytoplasmic/nuclear ratios versus their cytoplasmic/nucleolar ratio as either mock-treated (green) or etoposide- treated (red). D, Western blotting of the total cell lysate (TCL), Cyto, Nuc, and No fractions of either mock-treated (lanes 1–4) or etoposide-treated (lanes 5–8) cells with an MCM5 antibody. E and F, spectra for peptides from MCM5 derived from either mock-treated cells (E) or etoposide-treated cells (F) are displayed.

References

    1. Gilchrist A., Au C. E., Hiding J., Bell A. W., Fernandez-Rodriguez J., Lesimple S., Nagaya H., Roy L., Gosline S. J., Hallett M., Paiement J., Kearney R. E., Nilsson T., Bergeron J. J. (2006) Quantitative proteomics analysis of the secretory pathway. Cell 127, 1265–1281 - PubMed
    1. Kislinger T., Cox B., Kannan A., Chung C., Hu P., Ignatchenko A., Scott M. S., Gramolini A. O., Morris Q., Hallett M. T., Rossant J., Hughes T. R., Frey B., Emili A. (2006) Global survey of organ and organelle protein expression in mouse: combined proteomic and transcriptomic profiling. Cell 125, 173–186 - PubMed
    1. Wiese S., Gronemeyer T., Ofman R., Kunze M., Grou C. P., Almeida J. A., Eisenacher M., Stephan C., Hayen H., Schollenberger L., Korosec T., Waterham H. R., Schliebs W., Erdmann R., Berger J., Meyer H. E., Just W., Azevedo J. E., Wanders R. J., Warscheid B. (2007) Proteomics characterization of mouse kidney peroxisomes by tandem mass spectrometry and protein correlation profiling. Mol. Cell. Proteomics 6, 2045–2057 - PubMed
    1. Andersen J. S., Lyon C. E., Fox A. H., Leung A. K., Lam Y. W., Steen H., Mann M., Lamond A. I. (2002) Directed proteomic analysis of the human nucleolus. Curr. Biol 12, 1–11 - PubMed
    1. Andersen J. S., Mann M. (2006) Organellar proteomics: turning inventories into insights. EMBO Rep 7, 874–879 - PMC - PubMed

Publication types

MeSH terms

LinkOut - more resources