. 2010 Apr;38(6):1805-20.
doi: 10.1093/nar/gkp1172. Epub 2009 Dec 21.

Genome-wide localization analysis of a complete set of Tafs reveals a specific effect of the taf1 mutation on Taf2 occupancy and provides indirect evidence for different TFIID conformations at different promoters

Affiliations

Genome-wide localization analysis of a complete set of Tafs reveals a specific effect of the taf1 mutation on Taf2 occupancy and provides indirect evidence for different TFIID conformations at different promoters

Kazushige Ohtsuki et al. Nucleic Acids Res. 2010 Apr.

Abstract

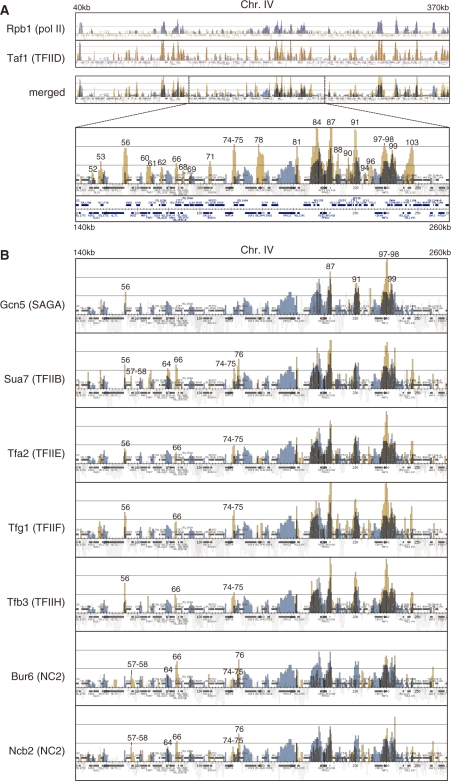
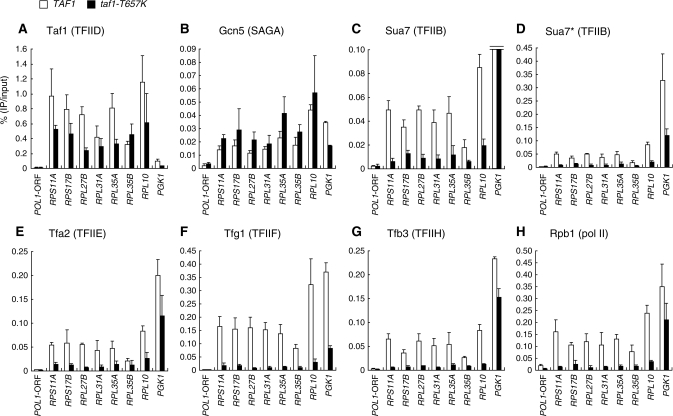
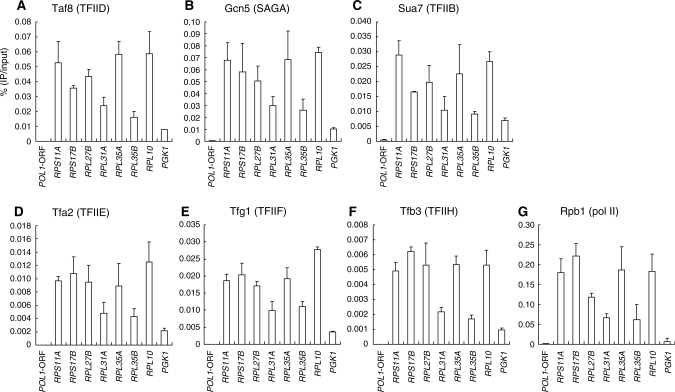
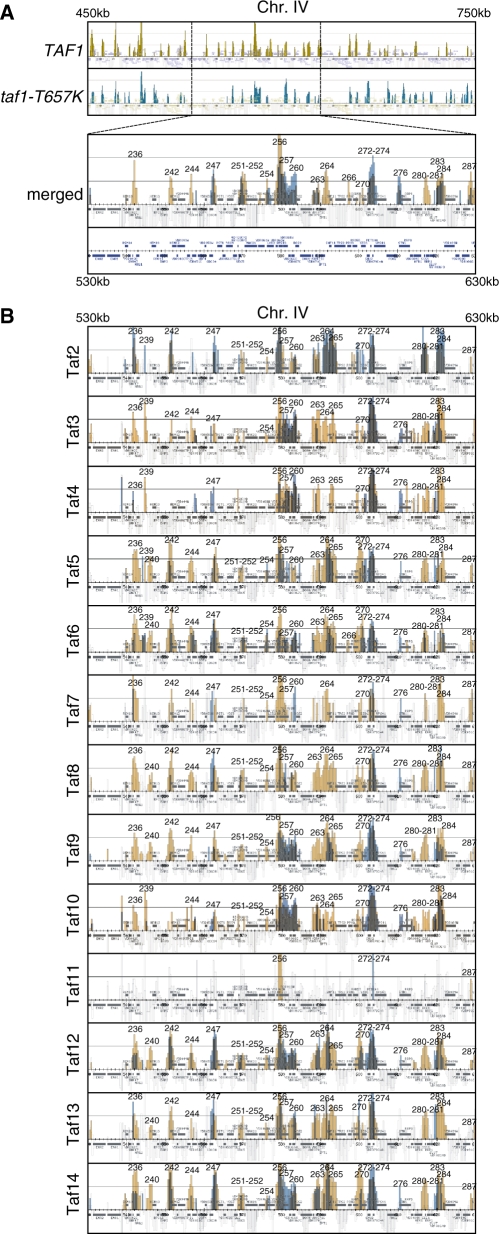
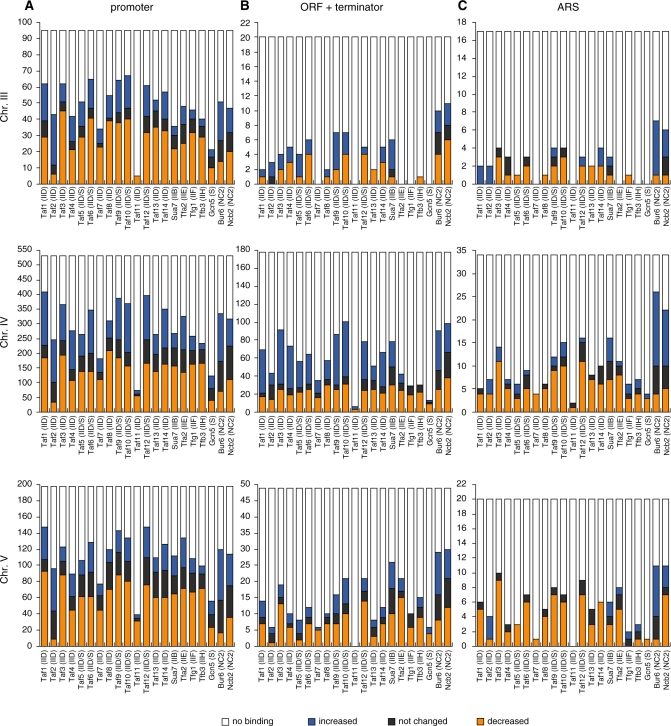
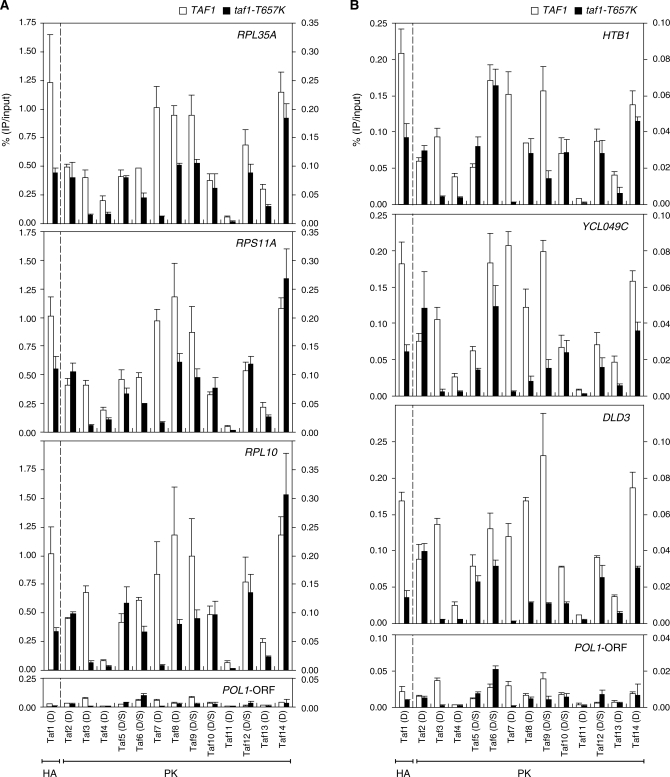
In Saccharomyces cerevisiae, TFIID and SAGA principally mediate transcription of constitutive housekeeping genes and stress-inducible genes, respectively, by delivering TBP to the core promoter. Both are multi-protein complexes composed of 15 and 20 subunits, respectively, five of which are common and which may constitute a core sub-module in each complex. Although genome-wide gene expression studies have been conducted extensively in several TFIID and/or SAGA mutants, there are only a limited number of studies investigating genome-wide localization of the components of these two complexes. Specifically, there are no previous reports on localization of a complete set of Tafs and the effects of taf mutations on localization. Here, we examine the localization profiles of a complete set of Tafs, Gcn5, Bur6/Ncb2, Sua7, Tfa2, Tfg1, Tfb3 and Rpb1, on chromosomes III, IV and V by chromatin immunoprecipitation (ChIP)-chip analysis in wild-type and taf1-T657K mutant strains. In addition, we conducted conventional and sequential ChIP analysis of several ribosomal protein genes (RPGs) and non-RPGs. Intriguingly, the results revealed a novel relationship between TFIIB and NC2, simultaneous co-localization of SAGA and TFIID on RPG promoters, specific effects of taf1 mutation on Taf2 occupancy, and an indirect evidence for the existence of different TFIID conformations.


Figures

Figure 1.
Figure 1.
Localization of general transcription factors (GTFs) and RNA polymerase II (pol II) on chromosomes III, IV and V. (A) Comparison of the localization of Rpb1 (a subunit of pol II, top panel) and Taf1 (a subunit of TFIID, second panel) by combining these two images into one (third panel) denoted as ‘merged’ at left. The strain YTK2741 expressing HA-tagged Taf1 was grown in YPD (yeast extract, peptone, dextrose) medium to mid-log phase at 25°C. Two hours after the temperature shift to 37°C, the cross-linked chromatin was prepared and precipitated with anti-CTD (Rpb1) or anti-HA (Taf1) monoclonal antibodies, and then analyzed by GeneChip (SC3456a 52005F, P/N 520015; Affymetrix). The blue and orange vertical bars represent the significant occupancy by Rpb1 and Taf1 at the region from 40 000 to 370 000 on chromosome IV, respectively. The light gray bars underneath the colored bars (e.g. blue) indicate the signals derived from other-colored factors (e.g. orange) that are not enriched significantly in the immunoprecipitated fraction (49). The horizontal small squares with a different color in each panel indicate the ORFs. The bottom panel represents the enlarged image corresponding to the region from 140 000 to 260 000 of the third ‘merged’ panel. In these ‘merged’ images, the thick colored vertical bars are shown in light colors to increase their transparency. Note that the ORFs are also drawn below the bottom panel as they were partly overlapped by the vertical bars in their original positions. The numbers above the occupancy signals correspond to those in Supplementary Table S3. (B) Comparison of the localization of Gcn5 (a subunit of SAGA, top panel), Sua7 (TFIIB, second panel), Tfa2 (a subunit of TFIIE, third panel), Tfg1 (a subunit of TFIIF, fourth panel), Tfb3 (a subunit of TFIIH, fifth panel), Bur6 (a subunit of NC2, sixth panel) and Ncb2 (another subunit of NC2, bottom panel), with that of Rpb1 by generating merged images of the same region (from 140 000 to 260 000) of chromosome IV as described for Taf1 in (A). The strains YTK6831 (Gcn5), YTK6837 (Sua7), YTK6838 (Tfa2), YTK6839 (Tfg1), YTK6840 (Tfb3), YTK6842 (Bur6) and YTK6843 (Ncb2) were cultured and cross-linked as described in (A). ChIP analysis was conducted as described in (A) except that anti-PK monoclonal antibody was used to precipitate these transcription factors. Note that the localization profile of Rpb1 represented as ‘blue’ signals in each panel is the same as described in A, which was obtained from YTK2741. The complete data sets including Tafs are represented in Supplementary Figures S5–7.
Figure 2.
Figure 2.
Effects of the taf1-T657K mutation on the localization of GTFs and pol II at a subset of class II gene promoters. Strains expressing HA-tagged TAF1 (YTK2741) or taf1-T657K (YTK3780) alone or in combination with PK-tagged GCN5 (YTK6831/YTK6858; this depicts TAF1/taf1-T657K strains, respectively), SUA7 (YTK6837/YTK6864), TFA2 (YTK6838/YTK6865), TFG1 (YTK6839/YTK6866) or TFB3 (YTK6840/YTK6867) were cultured and cross-linked as described in Figure 1. The cross-linked chromatin was prepared and precipitated with anti-CTD (Rpb1, H), anti-HA (Taf1, A) or anti-PK (Gcn5, B; Sua7, C–D; Tfa2, E; Tfg1, F; Tfb3, G) monoclonal antibodies. After the cross-link reversal, quantitative PCR was carried out in triplicate to determine the recovery ratio of DNA corresponding to the promoters of several genes or POL1 ORF (negative control) as indicated at the bottom of each panel. The average values from three independent experiments with standard deviations of the ratios of precipitated DNA to the inputs are shown as white (TAF1) or black (taf1-T657K) bars in each panel. YTK2741 and YTK3780 strains were used to assess occupancy levels of Taf1 and Rpb1. Note that the data for Sua7 are shown in two panels (C and D) with different scales on the vertical axis as occupancy levels varied greatly between PGK1 and ribosomal protein genes.
Figure 3.
Figure 3.
Co-occupancy by TFIID and SAGA at the promoters of several class II genes. Strains expressing HA-tagged TAF1 (YTK2741) alone or in combination with PK-tagged TAF8 (YTK6824), GCN5 (YTK6831), SUA7 (YTK6837), TFA2 (YTK6838), TFG1 (YTK6839) or TFB3 (YTK6840) were cultured and cross-linked as described in Figure 1. The cross-linked chromatin was prepared and precipitated with anti-HA monoclonal antibody. The eluates were then re-precipitated with anti-CTD (Rpb1, G) or anti-PK (Taf8, A; Gcn5, B; Sua7, C; Tfa2, D; Tfg1, E; Tfb3, F) monoclonal antibodies. After the cross-link reversal, quantitation of the ratio of DNA recovered after the second immuno-precipitation step to the input was performed as described in Figure 2. The data from three independent experiments are presented as mean ± SD.
Figure 4.
Figure 4.
Effects of the taf1-T657K mutation on the localization of Tafs on chromosomes III, IV and V. (A) Comparison of Taf1 localization in wild-type (top panel; significant occupancy is indicated by orange vertical bars) and taf1-T657K (second panel; significant occupancy is indicated by blue vertical bars) strains by combining two images into one (bottom panel, denoted as ‘merged’). Note that the region from 450 000 to 750 000 of chromosome IV is shown in the top two panels, whereas only a part of this region (from 530 000 to 630 000) is selectively shown as an enlarged image in the bottom ‘merged’ panel. The strains YTK2741 and YTK3780 expressing HA-tagged Taf1 and Taf1-T657K, respectively, were cultured and cross-linked as described in Figure 1A. The cross-linked chromatin was prepared and precipitated with anti-HA monoclonal antibody, and then analyzed by GeneChip as described in Figure 1A. The numbers above the occupancy signals correspond to those in Supplementary Table S3. (B) Comparison of the localization of the Tafs (i.e. Taf2-Taf14 as denoted at the left of each panel) in wild-type (orange bars) and taf1-T657K (blue bars) strains by generating merged images of the same region (from 530 000 to 630 000) of chromosome IV as described for Taf1 in A. Each pair of strains expressing one of the PK-tagged TAF genes as well as either HA-tagged TAF1 or taf1-T657K, which is abbreviated as [PK-tagged]TAFX (strain #[HA-tagged TAF1]/strain #[HA-tagged taf1-T657K]), i.e. TAF2 (YTK6818/YTK6845), TAF3 (YTK6819/YTK6846), TAF4 (YTK6820/YTK6847), TAF5 (YTK6821/YTK6848), TAF6 (YTK6822/YTK6849), TAF7 (YTK6823/YTK6850), TAF8 (YTK6824/YTK6851), TAF9 (YTK6825/YTK6852), TAF10 (YTK6826/YTK6853), TAF11 (YTK6827/YTK6854), TAF12 (YTK6828/YTK6855), TAF13 (YTK6829/YTK6856) or TAF14 (YTK6830/YTK6857), was cultured and cross-linked as described in (A). The cross-linked chromatin was prepared and precipitated with anti-PK monoclonal antibody, and then analyzed by GeneChip as described in (A). The complete data sets including Gcn5, NC2, pol II and other GTFs are represented in Supplementary Figures S8–10.
Figure 5.
Figure 5.
Effects of taf1-T657K mutation on the number of occupancy sites for GTFs, Tafs, Gcn5 and NC2 on chromosomes III, IV and V. The number (y-axis) of occupancy sites for each factor that is shown below the x-axis (letters inside parentheses are abbreviations that specify originated GTF or complexes; e.g. IIB/D/E/F/H and S refer to TFIIB/D/E/F/H and SAGA, respectively) was counted separately for the promoter regions of class II genes (A), open reading frames (ORF) and the terminator regions of class II genes (B), and autonomously replicating sequences (ARS) (C). The results are summarized for each chromosome: III (top panels), IV (middle panels), and V (bottom panels). In all panels, the occupancy sites are categorized into four groups that are labeled with different colors. Orange, blue and black bars indicate the sites where the occupancy level of a given factor was weakened, strengthened, or not changed, respectively, in taf1-T657K strains when compared with wild-type strains, while white bars indicate the sites that are not bound by a given factor but are bound by one of the other factors shown below the x-axis. These data were originally derived from Supplementary Figures S8–10, and the counting details are summarized in Supplementary Table S3.
Figure 6.
Figure 6.
Effects of taf1-T657K mutation on the occupancy levels of Tafs at a subset of class II gene promoters. (A) Comparison of Taf occupancy at the promoters of three ribosomal protein genes, RPL35A (top panel), RPS11A (second panel) and RPL10 (third panel), or POL1-ORF (bottom panel, negative control) in wild-type (indicated by white bars) and taf1-T657K (indicated by black bars) strains. ChIP analysis was conducted as described in Figure 2 using the same set of strains described in Figure 4. Quantitation of DNA that was recovered after the immuno-precipitation was performed as described in Figure 2. The data from three independent experiments are presented as mean ± SD. Note that the left and right y-axes are scaled differently to better display the data for Taf1 (obtained using an anti-HA monoclonal antibody) and the other Tafs (obtained using an anti-PK monoclonal antibody) in the same panel. Thus, each panel is divided into two parts by a broken vertical line. (B) Comparison of Taf occupancy at the promoters of the other three class II genes, i.e. HTB1 (top panel), YCL049C (second panel) and DLD3 (third panel), or POL1-ORF (bottom panel, negative control) in wild-type (white bars) and taf1-T657K (black bars) strains. ChIP and DNA quantitation were performed as described in (A). Note that the data for POL1-ORF are the same as those in (A) but shown here on a different scale for comparison with the data for HTB1, YCL049C and DLD3.

Similar articles

Cited by

References

    1. Mellor J. The dynamics of chromatin remodeling at promoters. Mol. Cell. 2005;19:147–157. - PubMed
    1. Hahn S. Structure and mechanism of the RNA polymerase II transcription machinery. Nat. Struct. Mol. Biol. 2004;11:394–403. - PMC - PubMed
    1. Taatjes DJ, Marr MT, Tjian R. Regulatory diversity among metazoan co-activator complexes. Nat. Rev. Mol. Cell Biol. 2004;5:403–410. - PubMed
    1. Thomas MC, Chiang CM. The general transcription machinery and general cofactors. Crit. Rev. Biochem. Mol. Biol. 2006;41:105–178. - PubMed
    1. Tora L. A unified nomenclature for TATA box binding protein (TBP)-associated factors (TAFs) involved in RNA polymerase II transcription. Genes Dev. 2002;16:673–675. - PubMed

Publication types

MeSH terms