. 2010 Feb 19;285(8):5581-93.
doi: 10.1074/jbc.M109.052670. Epub 2009 Dec 21.

Farnesoid X receptor, through the binding with steroidogenic factor 1-responsive element, inhibits aromatase expression in tumor Leydig cells

Affiliations

Farnesoid X receptor, through the binding with steroidogenic factor 1-responsive element, inhibits aromatase expression in tumor Leydig cells

Stefania Catalano et al. J Biol Chem. .

Abstract

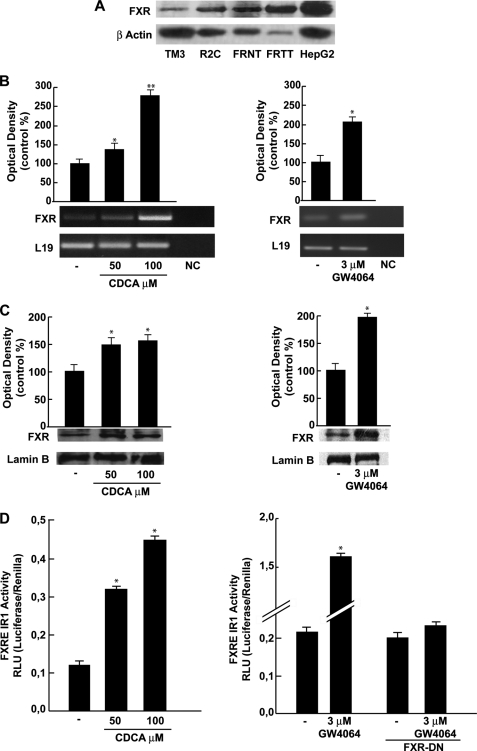
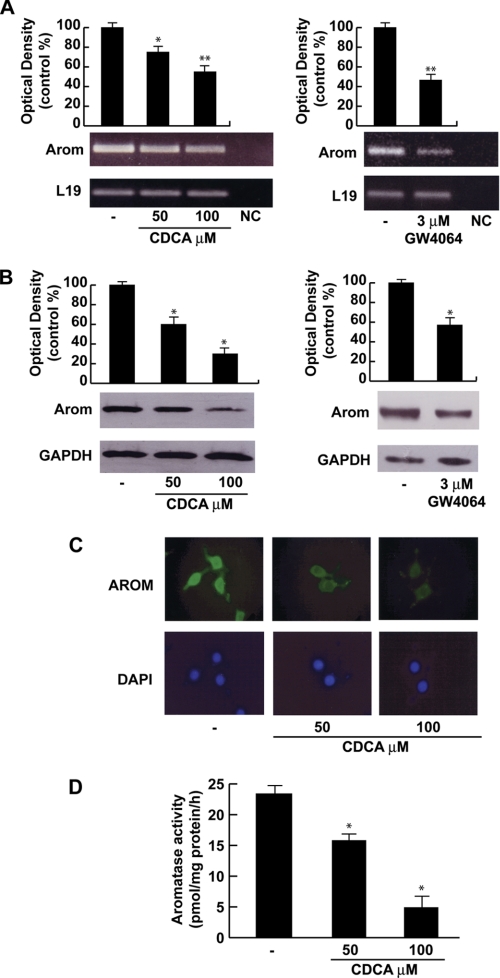
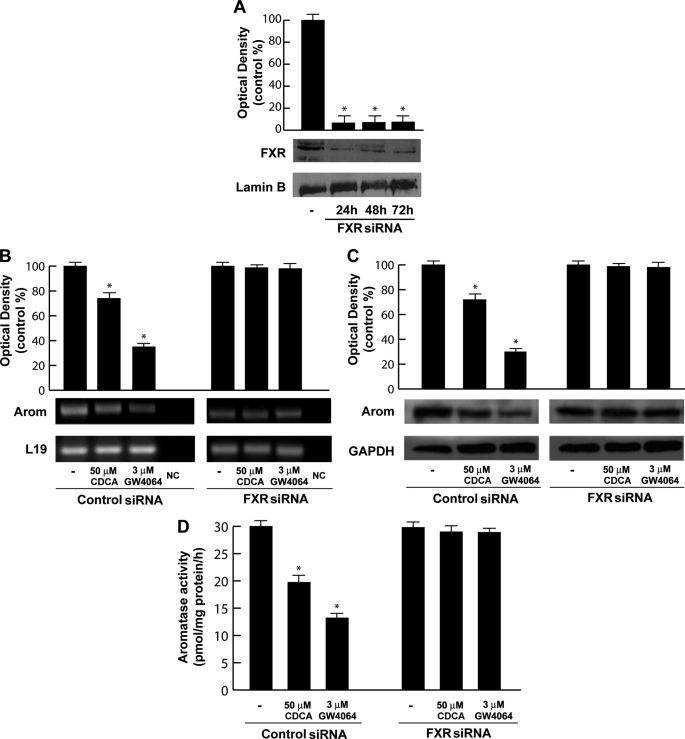
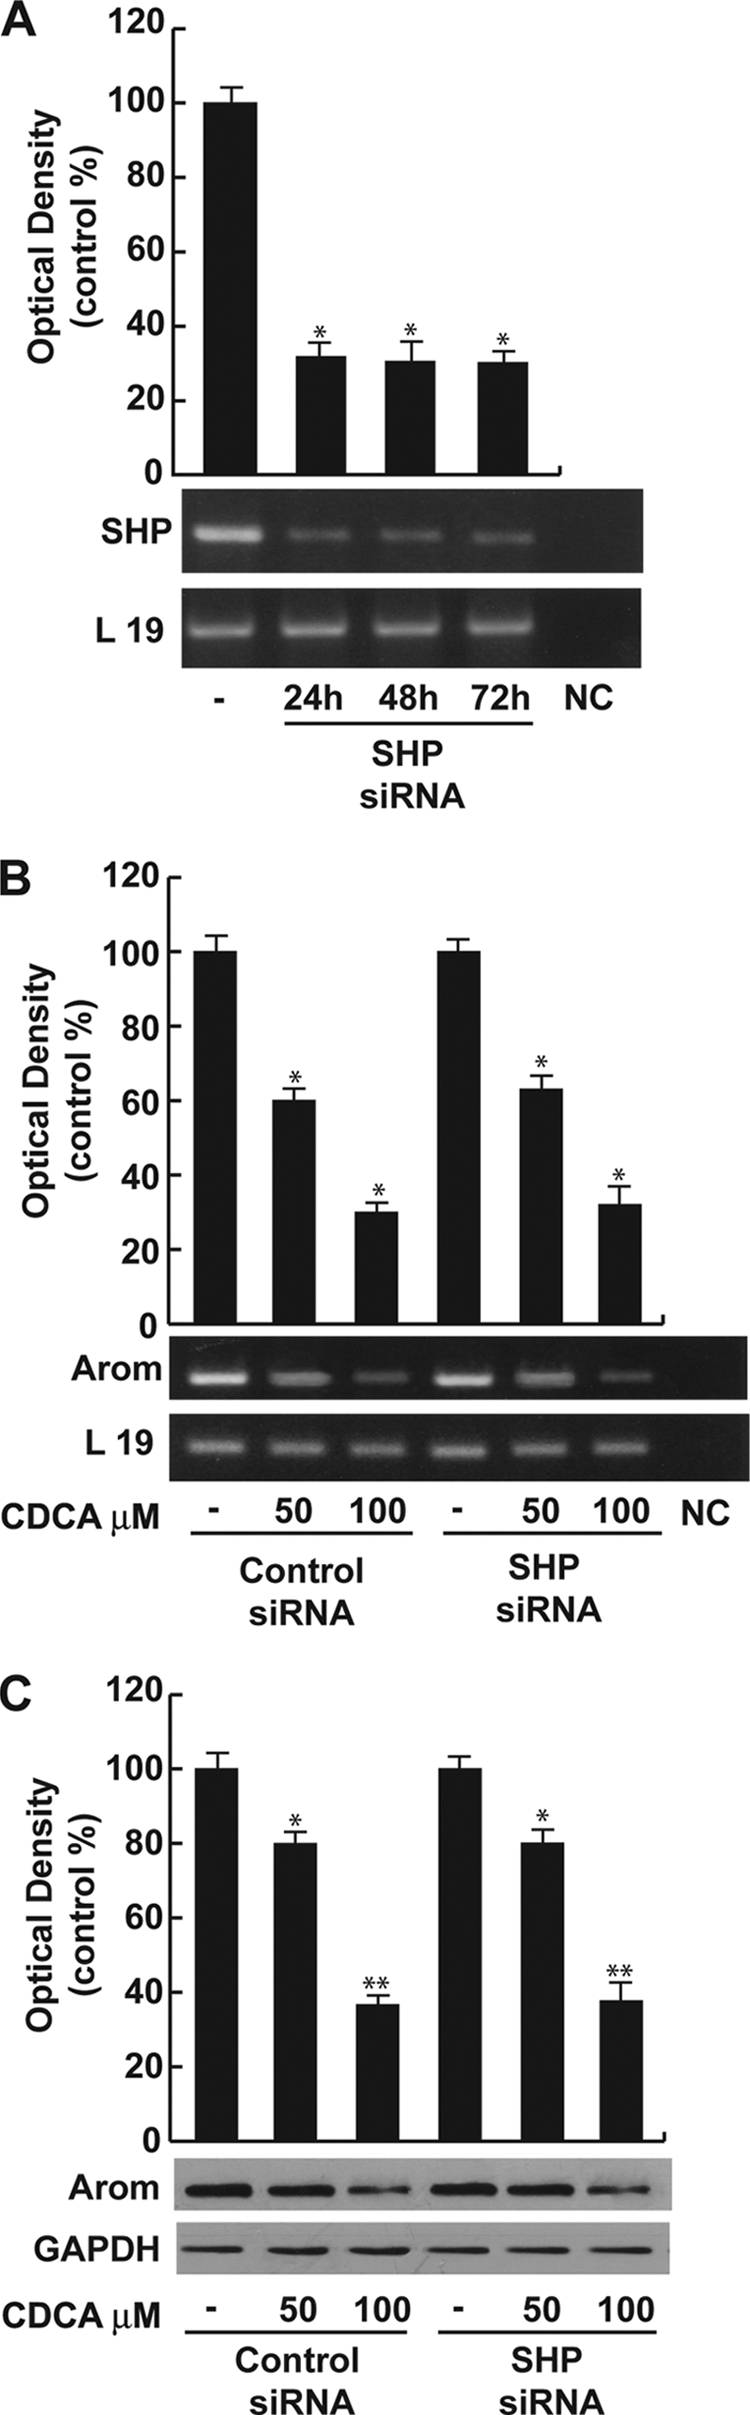
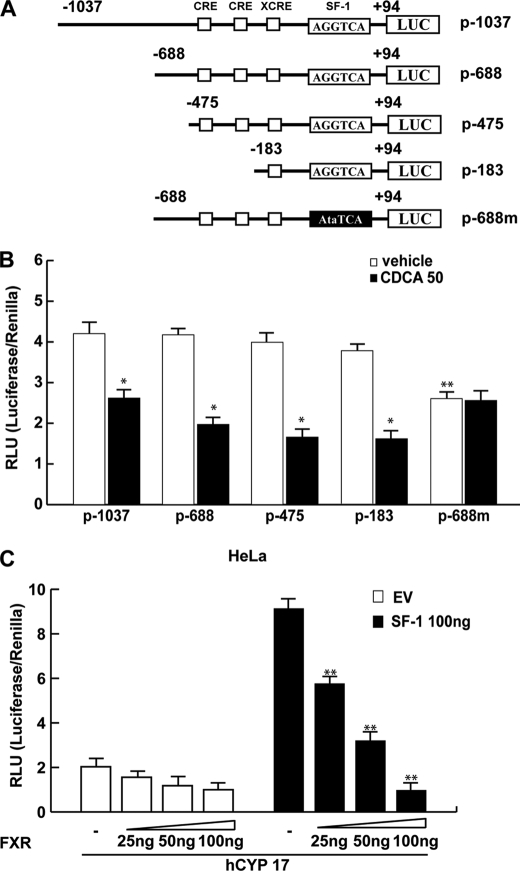
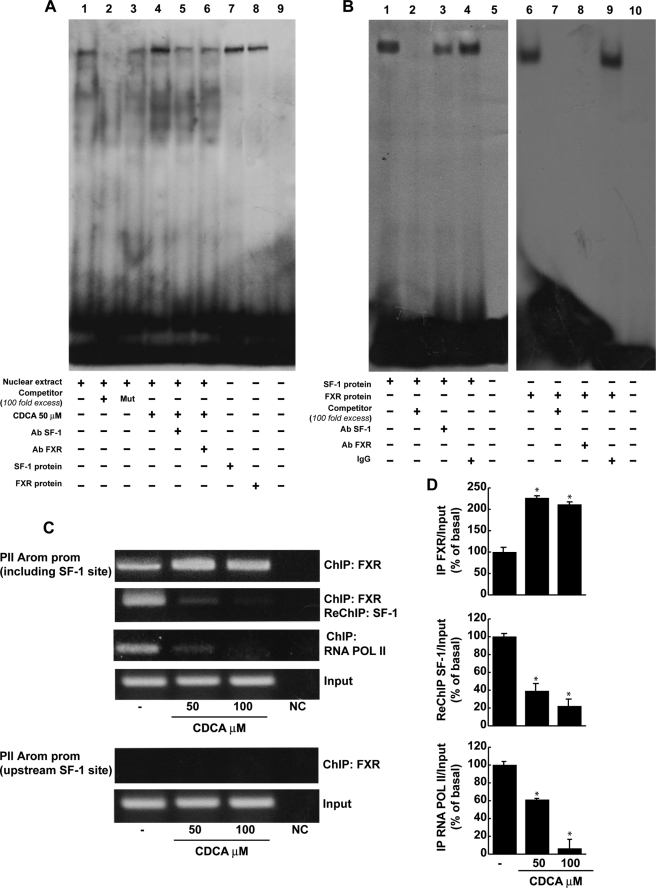
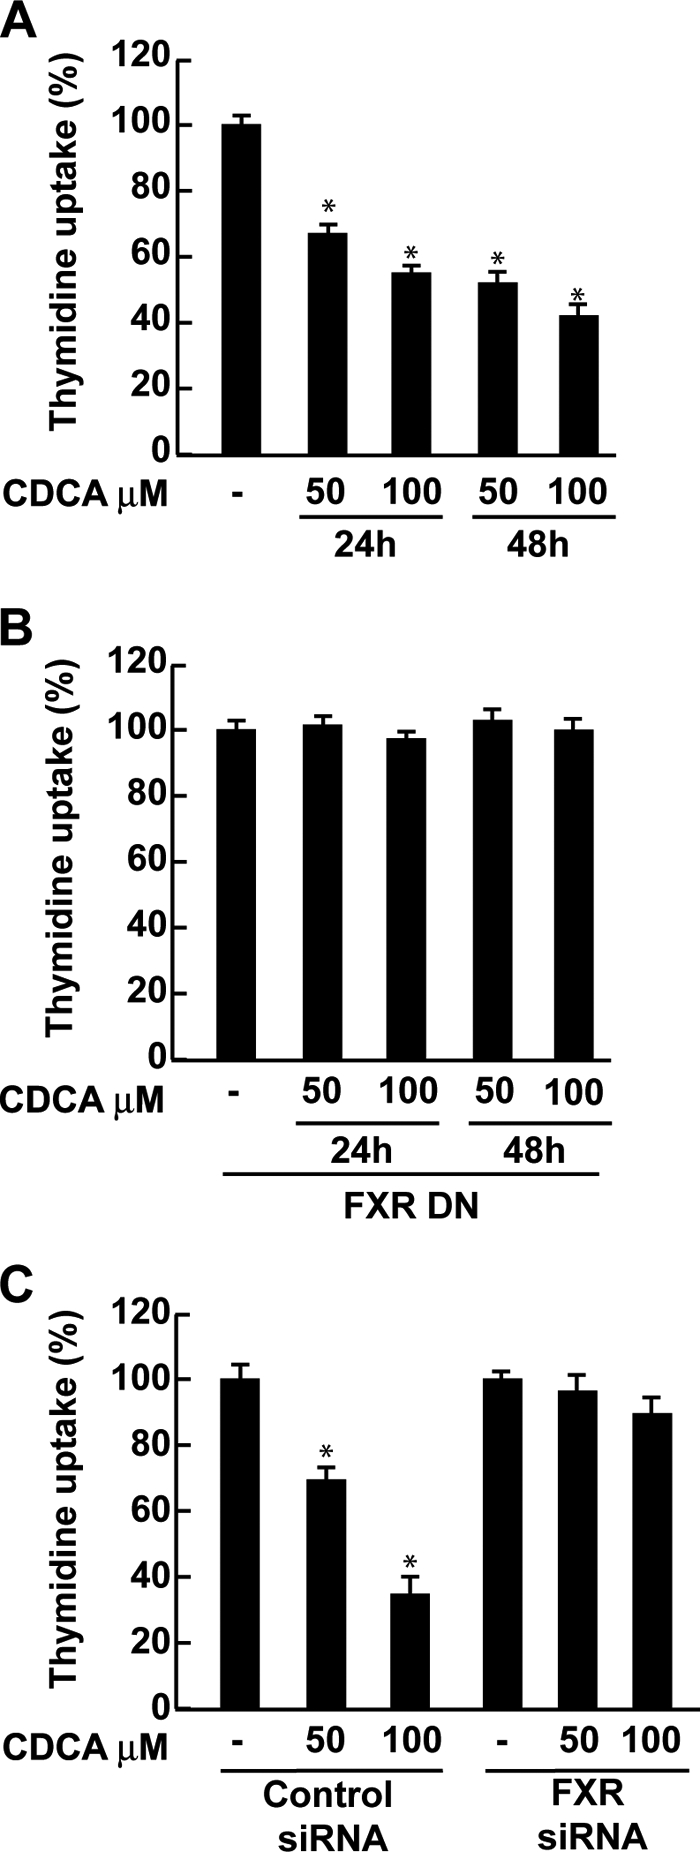
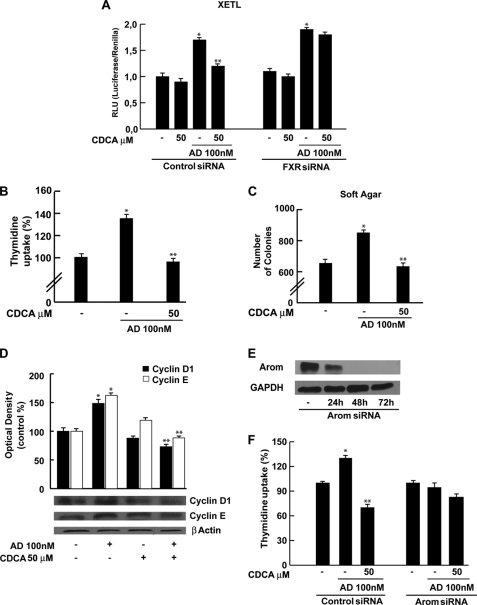
The farnesoid X receptor (FXR) is a member of the nuclear receptor superfamily that regulates bile acid homeostasis. It is expressed in the liver and the gastrointestinal tract, but also in several non-enterohepatic tissues including testis. Recently, FXR was identified as a negative modulator of the androgen-estrogen-converting aromatase enzyme in human breast cancer cells. In the present study we detected the expression of FXR in Leydig normal and tumor cell lines and in rat testes tissue. We found, in rat Leydig tumor cells, R2C, that FXR activation by the primary bile acid chenodeoxycholic acid (CDCA) or a synthetic agonist GW4064, through a SHP-independent mechanism, down-regulates aromatase expression in terms of mRNA, protein levels, and its enzymatic activity. Transient transfection experiments, using vector containing rat aromatase promoter PII, evidenced that CDCA reduces basal aromatase promoter activity. Mutagenesis studies, electrophoretic mobility shift, and chromatin immunoprecipitation analysis reveal that FXR is able to compete with steroidogenic factor 1 in binding to a common sequence present in the aromatase promoter region interfering negatively with its activity. Finally, the FXR-mediated anti-proliferative effects exerted by CDCA on tumor Leydig cells are at least in part due to an inhibition of estrogen-dependent cell growth. In conclusion our findings identify for the first time the activators of FXR as negative modulators of the aromatase enzyme in Leydig tumor cell lines.


Figures

FIGURE 1.
FIGURE 1.
FXR expression and activation in R2C cells. A, Western blot analysis of FXR was done on 50 μg of total proteins extracted from normal (TM3), tumor Leydig cells (R2C), and human hepatocytes cells (HepG2), or from tissues of normal (FRNT) and tumor (FRTT) Fisher rat testes. β-Actin was used as a loading control. B, total RNA was extracted from R2C cells treated with vehicle (−) or 50 and 100 μm CDCA or 3 μm GW4064 for 24 h and reverse transcribed. cDNA was subjected to PCR using primers specific for FXR or L19 (ribosomal protein). NC, negative control, RNA sample without the addition of reverse transcriptase. The histograms represent the mean ± S.D. (error bars) of three separate experiments in which band intensities were evaluated in terms of optical density arbitrary units and expressed as percentages of the control, which was assumed to be 100%. *, p < 0.05; **, p < 0.01 compared with vehicle. C, nuclear proteins were extracted from R2C cells treated with vehicle (−), 50 and 100 μm CDCA, or 3 μm GW4064 for 24 h and then Western blotting analysis was performed using anti-FXR antibody. Lamin B was used as loading control. The histograms represent the mean ± S.D. of three separate experiments in which band intensities were evaluated in terms of optical density arbitrary units and expressed as percentages of the control, which was assumed to be 100%. *, p < 0.05 compared with vehicle. D, R2C cells were transiently transfected with the FXR reporter gene (FXRE-IR1) and treated as reported above or co-transfected with FXR-DN and treated with vehicle (−) or 3 μm GW4064. The values represent the mean ± S.D. of three different experiments performed in triplicate. *, p < 0.01 compared with vehicle.
FIGURE 2.
FIGURE 2.
Effects of CDCA on aromatase expression and activity in R2C cells. A, total RNA was extracted from R2C cells treated with vehicle (−), 50 and 100 μm CDCA or 3 μm GW4064 for 24 h and reverse transcribed. cDNA was subjected to PCR using primers specific for P450 aromatase or L19. NC, negative control, RNA sample without the addition of reverse transcriptase. The histograms represent the mean ± S.D. (error bars) of three separate experiments in which band intensities were evaluated in terms of optical density arbitrary units and expressed as percentages of the control, which was assumed to be 100%. *, p < 0.05; **, p < 0.01 compared with vehicle. B, total proteins extracted from R2C cells treated with vehicle (−), 50 and 100 μm CDCA, or 3 μm GW4064 for 24 h were used for immunoblot analysis of aromatase. GAPDH was used as a loading control. The histograms represent the mean ± S.D. (error bars) of three separate experiments in which band intensities were evaluated in terms of optical density arbitrary units and expressed as percentages of the control, which was assumed to be 100%. *, p < 0.01 compared with vehicle. C, R2C cells were treated with vehicle (−) or 50 and 100 μm CDCA for 24 h and aromatase expression was determined by immunofluorescence analysis. 4′,6-Diamidino-2-phenylindole (DAPI) staining was used to visualize the cell nucleus. Each experiment is representative of at least 4. D, R2C were cultured in the presence of vehicle (−) or 50 and 100 μm CDCA for 24 h. Aromatase activity was performed as described under “Experimental Procedures.” The results obtained were expressed as picomole of [3H]H2O/h of release and were normalized for milligrams of protein (pmol/mg of proteins/h). The values represent the mean ± S.D. (error bars) of three different experiments each performed with triplicate samples. *, p < 0.01 compared with vehicle.
FIGURE 3.
FIGURE 3.
Effects of FXR silencing on aromatase expression in R2C cells. A, FXR protein in R2C cells that were not transfected (−) or transfected with siRNA targeted rat FXR mRNA sequence as reported under “Experimental Procedures” for 24, 48, and 72 h. GAPDH was used as loading control. The histograms represent the mean ± S.D. (error bars) of three separate experiments in which band intensities were evaluated in terms of optical density arbitrary units and expressed as percentages of the control, which was assumed to be 100%. *, p < 0.01 compared with not transfected cells. B–D, R2C cells were transfected with control siRNA or FXR siRNA for 24 h, and then treated with vehicle (−), 50 μm CDCA, or 3 μm GW4064 for 24 h. B, total RNA was extracted and reverse transcription-PCR analysis was performed to evaluate the expression of aromatase. L19 was used as loading control. NC, negative control, RNA sample without the addition of reverse transcriptase. C, total proteins were extracted and Western blotting analysis was performed. GAPDH was used as loading control. The histograms represent the mean ± S.D. of three separate experiments in which band intensities were evaluated in terms of optical density arbitrary units and expressed as percentages of the control, which was assumed to be 100%. *, p < 0.01 compared with vehicle. D, aromatase activity was performed as described under “Experimental Procedures.” The results obtained were expressed as picomole of [3H]H2O/h of release and were normalized for milligrams of protein (pmol/mg of proteins/h). The values represent the mean ± S.D. of three different experiments each performed with triplicate samples. *, p < 0.01 compared with vehicle.
FIGURE 4.
FIGURE 4.
SHP is not involved in CDCA-mediated down-regulation of aromatase. A, SHP mRNA expression in R2C cells that were not transfected (−) or transfected with the siRNA-targeted rat SHP mRNA sequence as described under “Experimental Procedures” for 24, 48, and 72 h. L19 was used as loading control. NC, negative control, RNA sample without the addition of reverse transcriptase. The histograms represent the mean ± S.D. (error bars) of three separate experiments in which band intensities were evaluated in terms of optical density arbitrary units and expressed as percentages of the control, which was assumed to be 100%. *, p < 0.01 compared with not transfected cells. B, R2C cells were transfected with control siRNA or SHP siRNA for 24 h, and then treated with vehicle (−) or 50 and 100 μm CDCA for 24 h. Total RNA was extracted and reverse transcription-PCR analysis was performed to evaluate the expression of aromatase. L19 was used as loading control. The histograms represent the mean ± S.D. of three separate experiments in which band intensities were evaluated in terms of optical density arbitrary units and expressed as percentages of the control, which was assumed to be 100%. *, p < 0.01 compared with vehicle. C, in the same experimental condition as B, total proteins were extracted and Western blotting analysis was performed. GAPDH was used as loading control. The histograms represent the mean ± S.D. of three separate experiments in which band intensities were evaluated in terms of optical density arbitrary units and expressed as percentages of the control, which was assumed to be 100%. *, p < 0.05; **, p < 0.01 compared with vehicle.
FIGURE 5.
FIGURE 5.
Functional interaction between FXR and the SF-1 site. A, schematic map of the P450arom proximal promoter PII constructs used in this study. All of the promoter constructs contain the same 3′ boundary (+94). The 5′ boundaries of the promoter fragments varied from −1037 to −183. Three putative CRE motifs (5′-CRE at −335; 3′-CRE at −231; XCRE at −169) are indicated as squares. The AGGTCA site (SF-1 RE at-90) is indicated as a rectangle. A mutated SF-1 binding site (SF-1 mut) is present in p-688m (black rectangle). B, aromatase transcriptional activity of R2C cells transfected with promoter constructs are shown. After transfection, cells were treated in the presence of vehicle (−) or 50 μm CDCA for 24 h. These results represent the mean ± S.D. (error bars) of three different experiments performed in triplicate. *, p < 0.01 with respect to the vehicle; **, p < 0.01 with respect to the control of p688. C, HeLa cells were transiently cotransfected with the CYP17 promoter and SF-1 plasmid or empty vector (EV) in the presence of increasing amounts of FXR expression plasmid. These results represent the mean ± S.D. of three different experiments performed in triplicate. In each experiment, the activities of the transfected plasmids were assayed in triplicate transfections. *, p < 0.01 with respect to the EV; **, p < 0.01 with respect to the SF-1 alone.
FIGURE 6.
FIGURE 6.
FXR binds to SF-1 site within the aromatase promoter region. A, nuclear extract from R2C cells were incubated with a double-stranded SF-1-specific sequence probe labeled with [γ-32P]ATP and subjected to electrophoresis in a 6% polyacrylamide gel (lane 1). Competition experiments were performed adding as competitor a 100-fold molar excess of unlabeled probe (lane 2) or a 100-fold molar excess of unlabeled oligonucleotide containing a mutated SF-1 RE (lane 3). Lane 4, nuclear extracts from CDCA (50 μm)-treated R2C cells. Lanes 5 and 6, CDCA-treated nuclear extracts were incubated with anti-SF-1 or anti-FXR antibodies, respectively. We used as positive controls transcribed and translated in vitro SF-1 (lane 7) and FXR (lane 8) proteins. Lane 9 contains probe alone. B, SF-1 protein (lane 1) and FXR protein (lane 6) was incubated with a double-stranded SF-1 sequence probe labeled with [γ-32P]ATP and subjected to electrophoresis in a 6% polyacrylamide gel. Competition experiments were performed adding as competitor a 100-fold molar excess of unlabeled probe (lanes 2 and 7). SF-1 and FXR proteins were incubated with anti-SF-1 antibody (lane 3), anti-FXR antibody (lane 8), or IgG (lanes 4 and 9). Lanes 5 and 10 contain probe alone. C, R2C cells were treated in the presence of vehicle (−) or 50 and 100 μm CDCA for 1 h, then cross-linked with formaldehyde, and lysed. The precleared chromatin was immunoprecipitated with anti-FXR, and anti-RNA Pol II antibodies and normal mouse serum (NC) as negative control. Chromatin immunoprecipitated with the anti-FXR antibody was re-immunoprecipitated with anti-SF-1 antibody. The PII promoter sequence including the SF-1 site and that located upstream of the SF-1 site were detected by PCR with specific primers, as described under “Experimental Procedures,” and D, a 5-μl volume of each sample and input were used for real time PCR. To determine input DNA, the PII promoter fragment was amplified from 30 μl of initial preparations of soluble chromatin before immunoprecipitations. Similar results were obtained in multiple independent experiments. *, p < 0.01 compared with vehicle.
FIGURE 7.
FIGURE 7.
CDCA effects on R2C cell proliferation. A, R2C cells were treated with vehicle (−) or 50 and 100 μm CDCA for 24 and 48 h, or B, transiently transfected with FXR dominant negative (FXR-DN) for 24 h and then treated as reported above, or C, transfected with control siRNA or FXR siRNA for 24 h and treated for 24 h with 50 and 100 μm CDCA. Thymidine incorporation assay was performed. The results represent the mean ± S.D. (error bars) of three different experiments each performed with triplicate samples, and expressed as percentage of growth versus control, which was assumed to be 100%. *, p < 0.01 compared with vehicle.
FIGURE 8.
FIGURE 8.
CDCA reverses the effects of AD on R2C cell proliferation. A, R2C cells were transfected with control siRNA or FXR siRNA for 24 h and then transiently transfected with the XETL promoter plasmid. Cells were treated with 50 μm CDCA in the with or without 100 nm AD for 24 h. These results represent the mean ± S.D. of three different experiments. In each experiment, the activities of the transfected plasmids were assayed in triplicate transfections. *, p < 0.01 with respect to the vehicle. **, p < 0.01 CDCA + AD treated versus AD alone. B, R2C cells were treated with 100 nm AD in the presence or not of 50 μm CDCA for 24 h. Thymidine incorporation assay was performed. The results represent the mean ± S.D. of three different experiments each performed with triplicate samples. *, p < 0.01 AD treated compared with vehicle. **, p < 0.01 CDCA + AD treated versus AD alone. C, R2C cells were seeded (10,000/well) in 0.5% agarose and treated as described above. Cells were allowed to grow for 14 days and then the number of colonies >50 μm were quantified and the results graphed. The results represent the mean ± S.D. of three different experiments each performed with triplicate samples. *, p < 0.01 AD treated compared with vehicle. **, p < 0.01 CDCA + AD treated versus AD alone. D, total proteins extracted from R2C cells treated with vehicle (−), 100 nm AD, 50 μm CDCA, and AD + CDCA for 24 h were used for immunoblot analysis of cyclin D1 and cyclin E. β-Actin was used as a loading control. The histograms represent the mean ± S.D. of three separate experiments in which band intensities were evaluated in terms of optical density arbitrary units and expressed as percentages of the control, which was assumed to be 100%. *, p < 0.01 AD treated compared with vehicle. **, p < 0.01 CDCA + AD treated versus AD alone. E, aromatase protein in R2C cells that were not transfected (−) or transfected with siRNA targeted rat aromatase mRNA sequence as described under “Experimental Procedures” for 24, 48, and 72 h. GAPDH was used as loading control. F, R2C cells were transfected with control siRNA or Arom siRNA for 48 h and then treated with 100 nm AD in the presence or not of 50 μm CDCA for 24 h. Thymidine incorporation assay was performed. The results represent the mean ± S.D. of three different experiments each performed with triplicate samples. *, p < 0.01 AD treated compared with vehicle. **, p < 0.01 CDCA + AD treated versus AD alone.

Similar articles

Cited by

References

    1. Forman B. M., Goode E., Chen J., Oro A. E., Bradley D. J., Perlmann T., Noonan D. J., Burka L. T., McMorris T., Lamph W. W., Evans R. M., Weinberger C. (1995) Cell 81, 687–693 - PubMed
    1. Makishima M., Okamoto A. Y., Repa J. J., Tu H., Learned R. M., Luk A., Hull M. V., Lustig K. D., Mangelsdorf D. J., Shan B. (1999) Science 284, 1362–1365 - PubMed
    1. Parks D. J., Blanchard S. G., Bledsoe R. K., Chandra G., Consler T. G., Kliewer S. A., Stimmel J. B., Willson T. M., Zavacki A. M., Moore D. D., Lehmann J. M. (1999) Science 284, 1365–1368 - PubMed
    1. Kalaany N. Y., Mangelsdorf D. J. (2006) Annu. Rev. Physiol. 68, 159–191 - PubMed
    1. Ananthanarayanan M., Balasubramanian N., Makishima M., Mangelsdorf D. J., Suchy F. J. (2001) J. Biol. Chem. 276, 28857–28865 - PubMed

Publication types

MeSH terms

LinkOut - more resources