. 2010 Feb 26;285(9):6337-47.
doi: 10.1074/jbc.M109.083477. Epub 2009 Dec 21.

Leukotriene BLT2 receptor monomers activate the G(i2) GTP-binding protein more efficiently than dimers

Affiliations

Leukotriene BLT2 receptor monomers activate the G(i2) GTP-binding protein more efficiently than dimers

Laure Arcemisbéhère et al. J Biol Chem. .

Abstract

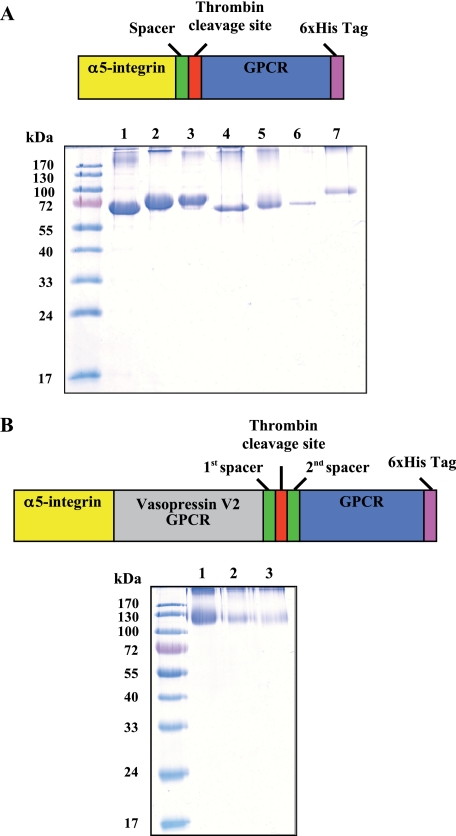
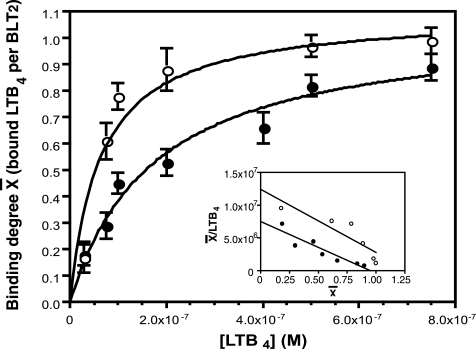
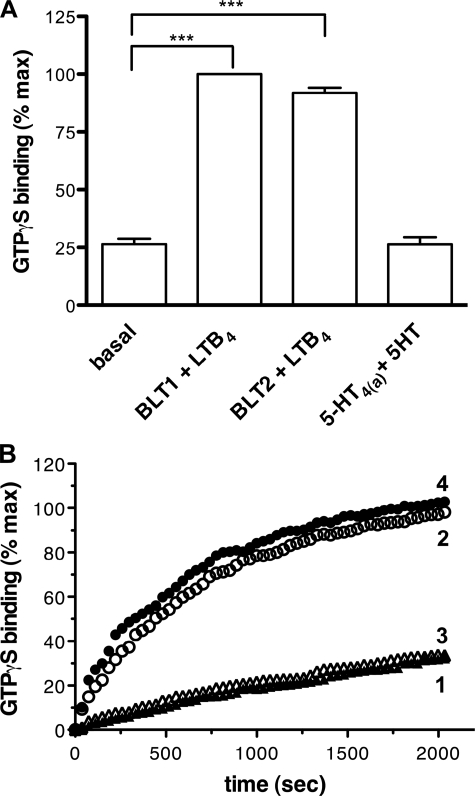
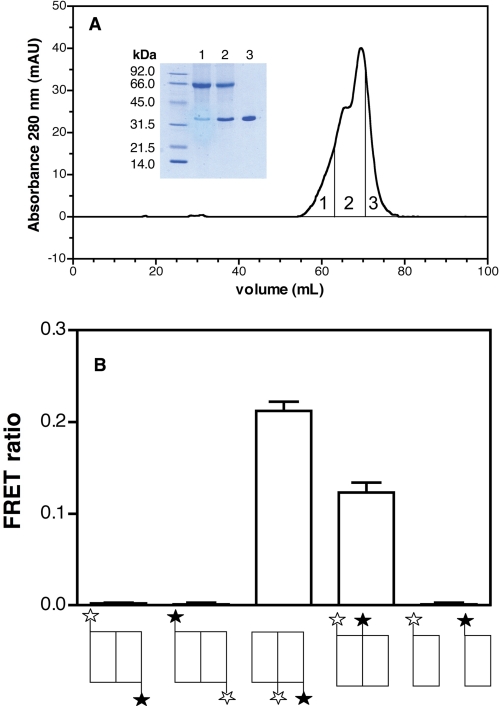
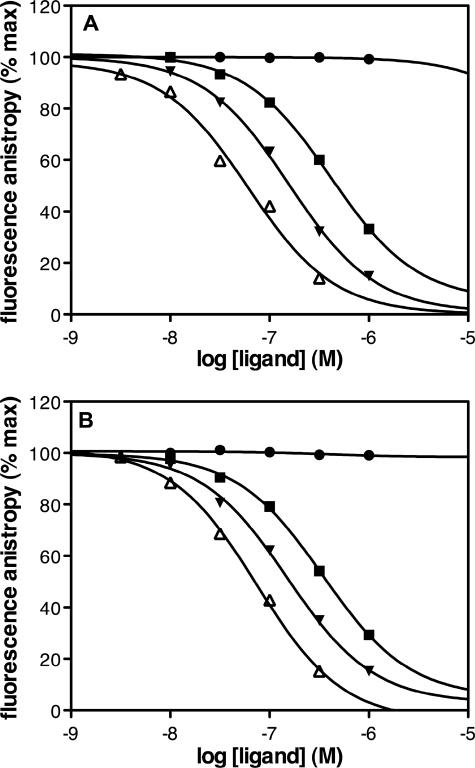
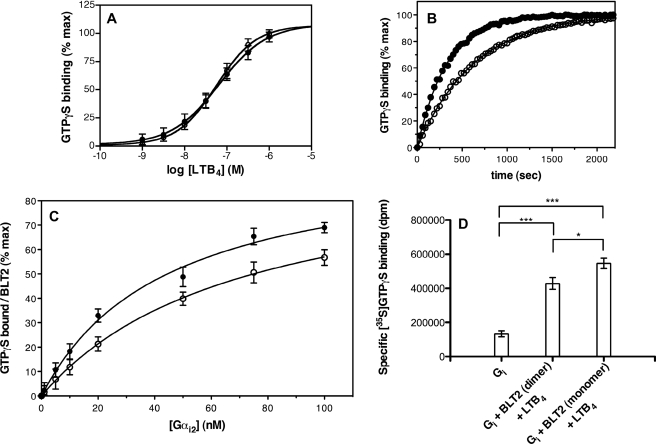
Accumulating evidence indicates that G protein-coupled receptors can assemble as dimers/oligomers but the role of this phenomenon in G protein coupling and signaling is not yet clear. We have used the purified leukotriene B(4) receptor BLT2 as a model to investigate the capacity of receptor monomers and dimers to activate the adenylyl cyclase inhibitory G(i2) protein. For this, we overexpressed the recombinant receptor as inclusion bodies in the Escherichia coli prokaryotic system, using a human alpha(5) integrin as a fusion partner. This strategy allowed the BLT2 as well as several other G protein-coupled receptors from different families to be produced and purified in large amounts. The BLT2 receptor was then successfully refolded to its native state, as measured by high-affinity LTB(4) binding in the presence of the purified G protein G alpha(i2). The receptor dimer, in which the two protomers displayed a well defined parallel orientation as assessed by fluorescence resonance energy transfer, was then separated from the monomer. Using two methods of receptor-catalyzed guanosine 5'-3-O-(thio)triphosphate binding assay, we clearly demonstrated that monomeric BLT2 stimulates the purified G alpha(i2) beta(1) gamma(2) protein more efficiently than the dimer. These data suggest that assembly of two BLT2 protomers into a dimer results in the reduced ability to signal.


Figures

FIGURE 1.
FIGURE 1.
Overexpression and purification of α5I-GPCR fusions. Samples were loaded onto 12% SDS-polyacrylamide gels and proteins stained with Coomassie Blue. To directly compare the purification yield, 10 μl of eluted fusions were put into each well. A, schematic representation of α5I-GPCR fusions and comparison of the corresponding purified proteins: V2, β3AR, ChemR23, BLT2, Cys-LT1, Cys-LT2, or CB1 receptor (lanes 1–7). B, schematic representation of α5I-V2-GPCR fusions and detection of the corresponding purified proteins. The entire α5I-V2 fusion was used as a new partner for expressing another GPCR: OTR, CXCR4, and CCR5 (lanes 1–3).
FIGURE 2.
FIGURE 2.
Binding of [3H]LTB4 to the refolded affinity-purified BLT2 receptor. Three series of ligand binding experiments were carried out by equilibrium dialysis in the absence (closed circles) or presence (open circles) of the purified Gαi2 protein (inset, corresponding Scatchard plots). The binding data are presented as a plot of the binding degree as a function of the ligand concentration. is defined by bound mole of LTB4 per mol of BLT2 (49). The experiments shown are representative of three independent trials, each performed in duplicate. Kd of [3H]LTB4 was calculated as explained under “Experimental Procedures.” Mean ± S.E. are given under “Results.” The statistics of the illustrated fits were as follow. The calculated Kd in the absence of G proteins was 217.8 ± 47.7 nm (22% error) with a binding ratio of 1.07 ± 0.08 (7.5% error). The calculated Kd in the presence of G proteins was 58.1 ± 18.9 nm (29% error) with a binding ratio of 1.09 ± 0.07 (6.5% error). Error bars are S.E. (calculated as S.D./root square (n −1)).
FIGURE 3.
FIGURE 3.
G protein coupling properties of the refolded affinity-purified BLT2 receptor. A, BLT2-catalyzed GTPγS binding assessed by changes in the fluorescence of Gαi2. Experiments were carried out with the refolded BLT2 (20 nm) in the absence or presence of saturating concentrations of LTB4 (50 μm). For comparison, BLT1 and 5HT4(a) were also used at 20 nm and their ligands at 1 and 10 μm, respectively. Mean ± S.E. are shown. Statistics are given: ***, p < 0.01. B, time course of the relative increase in the intrinsic fluorescence of Gαi2 upon addition of GTPγS. The fluorescence was monitored as described under “Experimental Procedures” in the presence of the purified BLT2 receptor in the absence of ligand (profile 1), in the presence of the LTB4 agonist (profile 2), or in the presence of the LY255283 antagonist (profile 3). The data were normalized to the changes induced by the purified BLT1 receptor in the presence of LTB4 (profile 4). The experiment illustrated here is representative of three independent assays. Error bars are S.E. (calculated as S.D./root square (n −1)).
FIGURE 4.
FIGURE 4.
Separation and characterization of monomeric and dimeric species of BLT2 receptor. A, separation of monomeric and dimeric species of BLT2 by SEC. The affinity-purified BLT2 preparation was loaded onto a Superose 6 column and separation of the different species was carried out as described under “Experimental Procedures.” The proteins eluted from the Superose 6 column were pooled in three fractions labeled 1, 2, and 3 as a function of their retention time, as indicated in the elution profile, and submitted to chemical cross-linking. Inset, SDS-PAGE analysis of the protein content in fractions 1–3 after chemical cross-linking. B, FRET ratio measured between Alexa Fluor-488- and Alexa Fluor-568-labeled BLT2 protomers. The species considered in each case are schematically represented below, where ☆ is the fluorescence donor and ★ the acceptor. The upper position represents N-terminal labeling, the lower position corresponds to C-terminal labeling. FRET ratios were calculated as indicated under “Experimental Procedures” (28). The experiments shown in the figure were repeated three times. Results are given as mean ± S.E. Error bars are S.E. (calculated as S.D./root square (n −1)).
FIGURE 5.
FIGURE 5.
Pharmacological profile of the BLT2 monomers and dimers. Fluorescence anisotropy-monitored competition experiments were carried out using the fluorescent LTB4-568 and the BLT2 monomer (A) or dimer (B) as described under “Experimental Procedures” (100 nm of monomers or dimers). Data are presented as fluorescence anisotropy (% of maximum, defined in the absence of displacing ligand) as a function of ligand concentration. Closed squares, LTB4; closed triangles, LY255283; closed circles, U75302; and open triangles, 12-HHT. The values are means from triplicates measured in an experiment representative of three independent assays, each done in triplicate.
FIGURE 6.
FIGURE 6.
Activation of the G protein Gαi2β1γ2 by monomeric and dimeric BLT2 receptors. A, LTB4 saturation of monomer (open circles) and dimer (closed circles) catalyzed GDP/GTP exchange. Data are presented as the percentage of maximal GTPγS binding as a function of LTB4 concentration. Results are given as mean ± S.E. calculated from three independent experiments. B, time-dependent activation of Gαi2 catalyzed by the LTB4-saturated form of the BLT2 monomer (closed circles) or dimer (open circles). Data are expressed as the percentage of maximal GTPγS binding as a function of time. The experiment shown is representative of three independent assays. In A and B, the BLT2 concentration was 20 nm, Gαi2 was 200 nm, and Gβ1γ2 were 500 nm. C, Gαi2 saturation of GDP/GTPγS exchange triggered by the BLT2 monomers (closed circles, fraction 3 in Fig. 4) and dimers (open circles, fraction 1 in Fig. 4). The contribution of the basal exchange (around 20% of the maximal receptor-catalyzed exchange) in the absence of agonist was systematically subtracted. The BLT2 concentration was 20 nm, those of Gβ1γ2 were in excess of 500 nm. Data are expressed as the percentage of maximal GTPγS binding normalized to BLT2 receptor concentration. The experiments shown in the figure were repeated three times. Results are given as mean ± S.E. D, [35S]GTPγS binding to the Gαi2 in the presence of LTB4-stimulated BLT2 monomers and dimers. BLT2 receptor preparations and Gαi2 were added at an equimolar ratio (20 nm each) in the presence of 500 nm G protein β1γ2 subunits. Data are expressed as specific dpm incorporated to the Gαi2. Mean ± S.E. are shown. Statistics are given: ***, p < 0.0001; *, p < 0.05. These experiments have been repeated at least three times, each done in triplicates. Error bars are S.E. (calculated as S.D./root square (n −1)).

References

    1. Bockaert J., Pin J. P. (1999) EMBO J. 18, 1723–1729 - PMC - PubMed
    1. Fredriksson R., Lagerström M. C., Lundin L. G., Schiöth H. B. (2003) Mol. Pharmacol. 63, 1256–1272 - PubMed
    1. Lefkowitz R. J. (2004) Trends Pharmacol. Sci. 25, 413–422 - PubMed
    1. Gurevich V. V., Gurevich E. V. (2008) Trends Neurosci. 31, 74–81 - PMC - PubMed
    1. Pin J. P., Kniazeff J., Liu J., Binet V., Goudet C., Rondard P., Prézeau L. (2005) FEBS J. 272, 2947–2955 - PubMed

Publication types

MeSH terms

Substances