

Ionic flow enhances low-affinity binding: a revised mechanistic view into Mg2+ block of NMDA receptors
- PMID: 20026615
- PMCID: PMC2828137
- DOI: 10.1113/jphysiol.2009.178913
Ionic flow enhances low-affinity binding: a revised mechanistic view into Mg2+ block of NMDA receptors
Abstract
The N-methyl-d-aspartate receptor (NMDAR) channel is one of the major excitatory amino acid receptors in the mammalian brain. Since external Mg(2+) blocks the channel in an apparently voltage-dependent fashion, this ligand-gated channel displays intriguing voltage-dependent control of Na(+) and Ca(2+) permeability and thus plays an important role in synaptic physiology. We found that the essential features of Mg(2+) block could not be solely envisaged by binding of a charged blocker in the membrane electric field. Instead, the blocking effect of Mg(2+) is critically regulated by, and quantitatively correlated with, the relative tendency of outward and inward ionic fluxes. The 'intrinsic' affinity of Mg(2+) to the binding sites, however, is low (in the millimolar range) in the absence of net ionic flow at 0 mV. Besides, extracellular and intracellular Mg(2+) blocks the channel at distinct sites of electrical distances 0.7 and 0.95 from the outside, respectively. The two sites are separated by a high energy barrier for the movement of Mg(2+) (but not Na(+) or the other ions), and functionally speaking, each could accommodate 1.1 and 0.8 coexisting permeating ions, respectively. Mg(2+) block of the ionic flow thus is greatly facilitated by the flux-coupling effect or the ionic flow (the preponderant direction of permeant ion movement) per se, as if the poorly permeable Mg(2+) is 'pushed' against a high energy barrier by the otherwise permeating ions. Extracellular and intracellular Mg(2+) block then is in essence 'use dependent', more strongly inhibiting both Na(+) and Ca(2+) fluxes with stronger tendencies of influx and efflux, respectively. In conclusion, although permeant ions themselves could compete with Mg(2+), the flow or the tendency of movement of the permeant ions may actually enhance rather than interfere with Mg(2+) block, making the unique current-voltage relationship of NMDAR and the molecular basis of many important neurobiological phenomena.
Figures
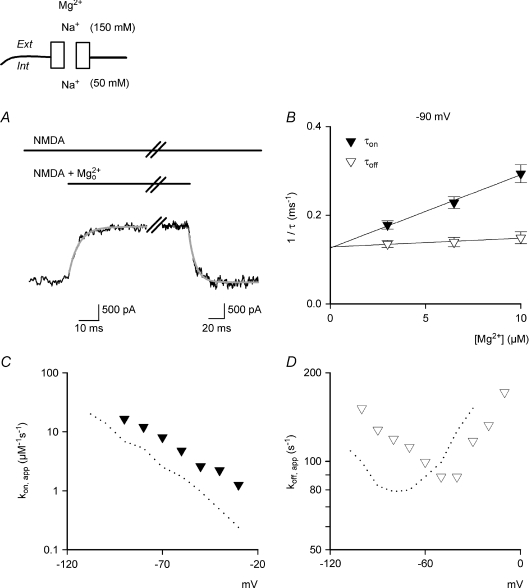
 to and from the steady-state NMDAR currents at −90 mV. The decay and recovery of the currents are fitted with monoexponential functions with time constants (τon and τoff) of 4.15 and 9.73 ms, respectively. B, the inverses of τon and τoff are plotted against [Mg2+]o. The lines are best linear regression fits to the data, and are of the form: 16.5 μ. Also, the y-intercepts of the regression lines for 1/τon and 1/τoff are essentially superimposed on each other. C and D, kon,app and koff,app are plotted against membrane voltage (n= 3–15). koff,app and kon,app are obtained from the y-intercept and slope of the regression fits to the mean values (with errors smaller than 15% of mean) of 1/τoff and 1/τon as shown in B, respectively. For comparison, the values of kon,app and koff,app in Fig. 3 are redrawn as dotted lines in the plots. The kon,app and koff,app with 150/50 m
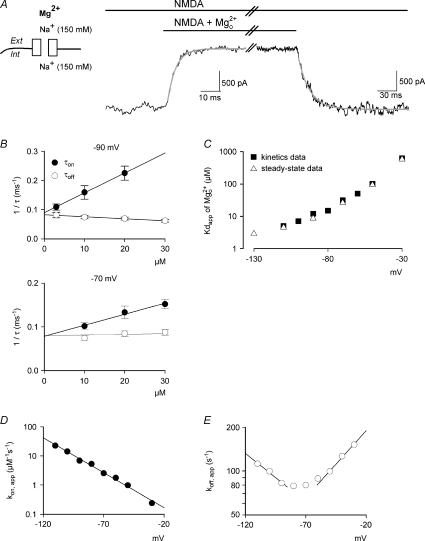 to and from the steady-state NMDAR currents at −90 mV. The decay and recovery of currents were fitted with monoexponential functions to obtain the time constants τon and τoff (4.1 and 16.9 ms, grey lines), respectively. The initial 10% of the current change was deliberately skipped from the fitting procedure to avoid inaccuracy from incomplete solution exchange. B, the inverses of τon and τoff from A are plotted against the concentration of ([Mg2+]o). The lines are the regression fits to the data, and are of the form: 1/τon= 6.8 μ. Note that the regression lines for 1/τon and 1/τoff essentially converge on the same point of y-intercept at either −90 mV (89.3 vs. 89.3) or −70 mV (78.3 vs. 79.6). C, the apparent dissociation constants (Kd,app) of can also be derived from: koff,app/kon,app. koff,app and kon,app are obtained from the y-intercept and slope of the regression fits to the mean values (with errors smaller than 15% of mean, n= 3–19) of 1/τoff and 1/τon as shown in B, respectively. The derived Kd,app from kinetic data (filled squares) are plotted against membrane voltage and are very much consistent with those from direct measurement of the reduction in steady-state currents (open triangles, data from Fig. 1C). D, the kon,app are plotted against membrane voltage (n= 3–19) and fitted with a regression line of the form: kon,app= 5.6 × 10⁴
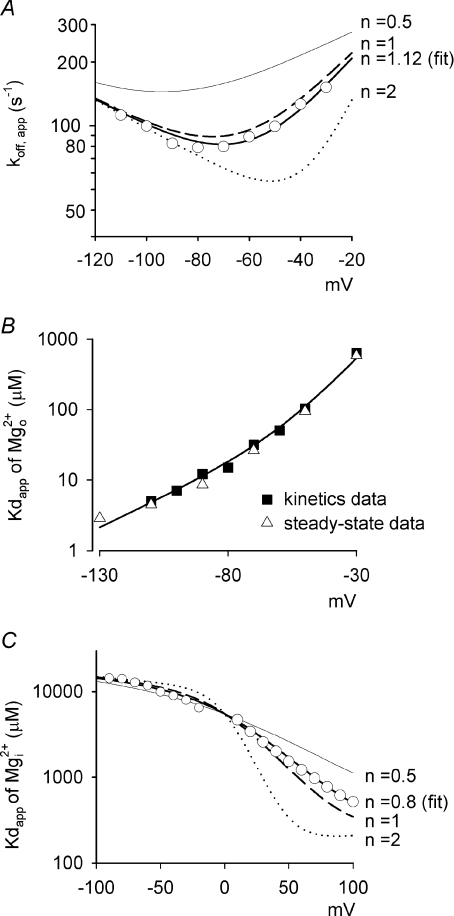
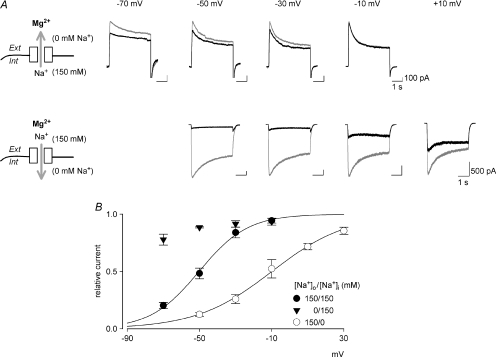 is markedly reduced in preponderant outward currents (with 0 m still significantly blocks the NMDAR currents even at +10 mV (lower panel). The arrows mark the ‘fixed’ direction of Na+ flow. In the outward current experiments, small ‘tail’ inward currents were present because the extracellular solution was changed to an agonist-free solution containing 150 m in different current-flow conditions (n= 3–10). The curves are the fits of the form: relative current = 1/{1 +[Mg2+]o/(4170 μ
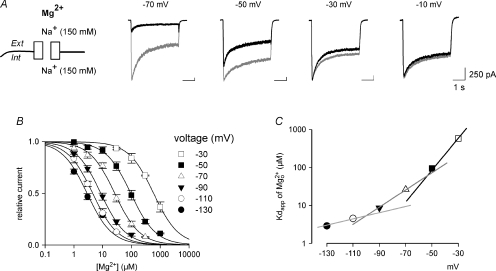 at different voltages (indicated on the top of the currents). B, inhibition of NMDAR currents by 1–1000 μ (n= 3–14). Relative steady-state currents in the presence and absence of are plotted against the concentration of ([Mg2+]o) on a semilogarithmic scale. The curves are the fits of the form: relative current = 1/[1 + ([Mg2+]o/Kd,app)], where Kd,app stands for the apparent dissociation constant of , and is 583.0, 94.5, 26.3, 8.6, 4.5 and 2.9 μ at different voltages are plotted on a semilogarithmic scale. We connected every two points with a straight line by hand. The slopes of the lines are evidently shallower toward more negative potentials.
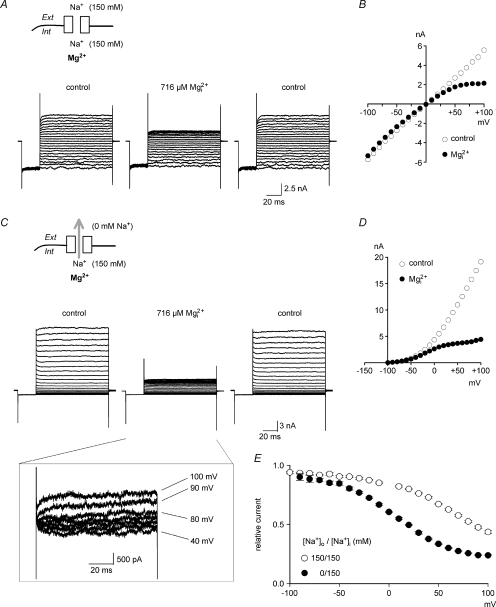
 from the data in A. C, the experimental protocols are the same as those in A, except that the patch was held at −40 mV with 0 m block is relieved at these strong positive membrane potentials. D, the I–V curve in the absence and presence of 716 μ from the data in C. E, the blocking effect of 716 μ (n= 3–37) with symmetrical 150 m.
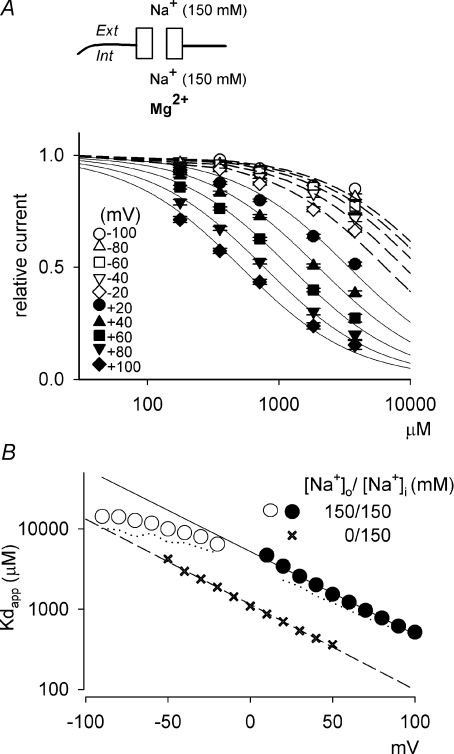 are examined at different membrane voltages. The relative current is defined as that in Fig. 1. The lines are the best fits of the form: relative current = 1/[1 + ([Mg2+]i/Kd,app)], where Kd,app stands for the apparent dissociation constant of (n= 5–37). The filled circles and continuous lines mark the data examined at positive membrane voltages, and the open circles and dashed lines mark those at negative voltages. B, the mean values of the Kd,app obtained from the fitting results in A are plotted against membrane voltages (filled and open circles for the data examined at positive and negative membrane voltages, respectively), showing evident non-linear relationship with symmetrical 150 m in A, and shows very similar results to the more accurately measured Kd,app described above (i.e. the circles). In this regard, the apparent dissociation constants of calculated from: relative current = 1/[1 + (716 μ
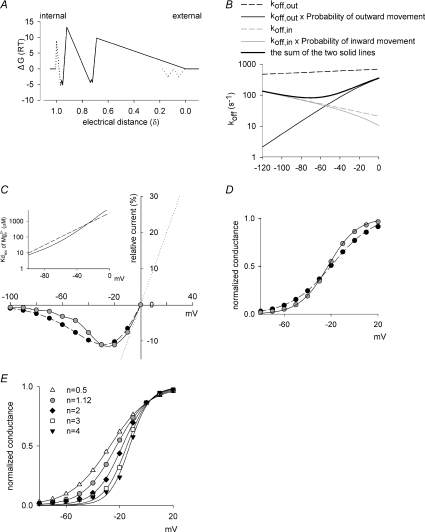 at different voltages. Based on the energy profile in A, the hypothetical outward and inward off rates considering only intrinsic voltage dependence are calculated (dashed lines). More realistic outward and inward off rates are derived with the additional considerations of flow dependence (with n= 1.12, continuous lines). The apparent off rates of the blocking predicted by the model are thus the sum of the two continuous lines (i.e. the thick line, which is identical to the thick line in Fig. 7A, the best fit of the experimental data from Fig. 3E). C, the contribution of flux coupling to blocking effect at different membrane voltages. In the inset, the continuous line is from Fig. 7B (with flux coupling taken into consideration), and the dashed line is the calculated dissociation constants if one considers only the intrinsic voltage dependence of the blocking site but not flux coupling (the experimental data point at −30 mV, i.e. 0.58 m (roughly the physiological concentration in human cerebrospinal fluid) is then derived based on the Kd,app values from the two lines in the inset according to a simple bimolecular (one-to-one binding) reaction. The remaining current after Mg2+ block is normalized to the current elicited at +100 mV (in the absence of Mg2+) to give the relative current (the y-axis), which is then plotted against membrane voltage. The grey filled circles (connected by continuous lines) and the black filled circles (connected by dashed lines) show the data in the presence and the absence of flux coupling, respectively. The dotted line denotes the current in the absence of Mg2+. D, the normalized conductance is also derived form the Kd,app values in C and plotted against membrane voltage. The curves are fitted with a Boltzmann function and are 1/[1 + e(−22.6−V)/18.1] and 1/[1 + e(−18.8−V)/12.3] in the absence (equivalent ‘gating charges’= 25/18.1 = 1.4, black filled circles, dashed lines) and presence (equivalent ‘gating charges’= 25/12.3 = 2.0, grey filled circles, continuous lines) of flux coupling, respectively. V is membrane potential in mV. E, the normalized conductance–voltage relationship is plotted as that described in D, but the number (n) of Na+ accompanying Mg2+ in the single file region is differently assigned (assuming complete coupling between or among Na+ and Mg2+). The curves are the fits with a Boltzmann function with V1/2 values of −27.1, −18.8, −18.0, −14.7 and −12.5, and k values of 14.8, 12.3, 10.0, 8.4 and 7.6 (and thus equivalent ‘gating charges’ of 1.7, 2.0, 2.5, 3.0 and 3.3) for n= 0.5, 1.12 (data from D), 2, 3 and 4, respectively.
Similar articles
-
Adjacent asparagines in the NR2-subunit of the NMDA receptor channel control the voltage-dependent block by extracellular Mg2+.J Physiol. 1998 Jan 1;506 ( Pt 1)(Pt 1):13-32. doi: 10.1111/j.1469-7793.1998.013bx.x. J Physiol. 1998. PMID: 9481670 Free PMC article.
-
Permeant ion effects on external Mg2+ block of NR1/2D NMDA receptors.J Neurosci. 2006 Oct 18;26(42):10899-910. doi: 10.1523/JNEUROSCI.3453-06.2006. J Neurosci. 2006. PMID: 17050728 Free PMC article.
-
Intracellular Mg2+ interacts with structural determinants of the narrow constriction contributed by the NR1-subunit in the NMDA receptor channel.J Physiol. 1998 Jan 1;506 ( Pt 1)(Pt 1):33-52. doi: 10.1111/j.1469-7793.1998.00033.x. J Physiol. 1998. PMID: 9481671 Free PMC article.
-
Multiple structural determinants of voltage-dependent magnesium block in recombinant NMDA receptors.Neuropharmacology. 1993 Nov;32(11):1203-11. doi: 10.1016/0028-3908(93)90014-t. Neuropharmacology. 1993. PMID: 8107974
-
Channel gating of NMDA receptors.Physiol Behav. 2002 Dec;77(4-5):577-82. doi: 10.1016/s0031-9384(02)00906-x. Physiol Behav. 2002. PMID: 12527002 Review.
Cited by
-
Ionic mechanisms underlying tonic and phasic firing behaviors in retinal ganglion cells: a model study.Channels (Austin). 2014;8(4):298-307. doi: 10.4161/chan.28012. Channels (Austin). 2014. PMID: 24769919 Free PMC article.
-
Cannabinoid receptor activation modifies NMDA receptor mediated release of intracellular calcium: implications for endocannabinoid control of hippocampal neural plasticity.Neuropharmacology. 2011 May;60(6):944-52. doi: 10.1016/j.neuropharm.2011.01.039. Epub 2011 Feb 1. Neuropharmacology. 2011. PMID: 21288475 Free PMC article.
-
Noncompetitive, voltage-dependent NMDA receptor antagonism by hydrophobic anions.Mol Pharmacol. 2013 Feb;83(2):354-66. doi: 10.1124/mol.112.081794. Epub 2012 Nov 9. Mol Pharmacol. 2013. PMID: 23144238 Free PMC article.
-
Data-driven modeling of synaptic transmission and integration.Prog Mol Biol Transl Sci. 2014;123:305-50. doi: 10.1016/B978-0-12-397897-4.00004-8. Prog Mol Biol Transl Sci. 2014. PMID: 24560150 Free PMC article. Review.
-
The biochemical and cellular basis for nutraceutical strategies to attenuate neurodegeneration in Parkinson's disease.Int J Mol Sci. 2011 Jan 17;12(1):506-69. doi: 10.3390/ijms12010506. Int J Mol Sci. 2011. PMID: 21340000 Free PMC article. Review.
References
-
- Antonov SM, Gmiro VE, Johnson JW. Binding sites for permeant ions in the channel of NMDA receptors and their effects on channel block. Nat Neurosci. 1998;1:451–461. - PubMed
Publication types
MeSH terms
Substances
LinkOut - more resources
Full Text Sources
Miscellaneous