. 2010 Jan 18;207(1):117-28.
doi: 10.1084/jem.20091568. Epub 2009 Dec 21.

Exaggerated inflammation, impaired host defense, and neuropathology in progranulin-deficient mice

Affiliations

Exaggerated inflammation, impaired host defense, and neuropathology in progranulin-deficient mice

Fangfang Yin et al. J Exp Med. .

Abstract

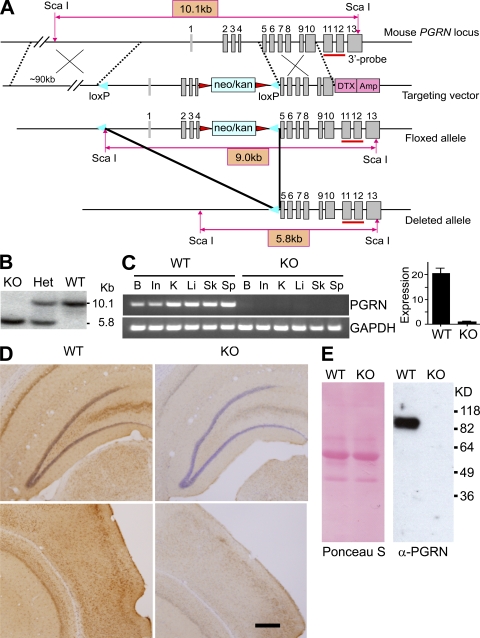
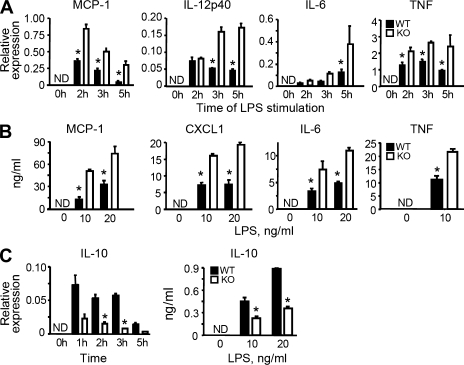
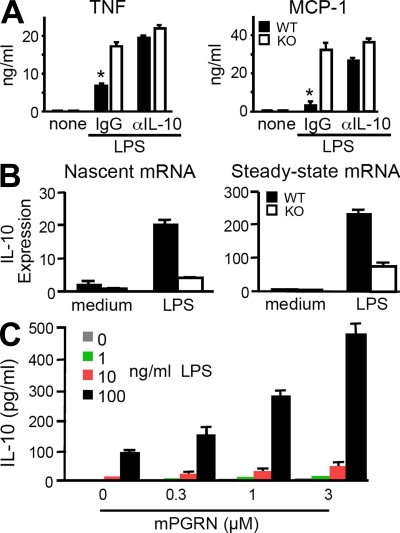
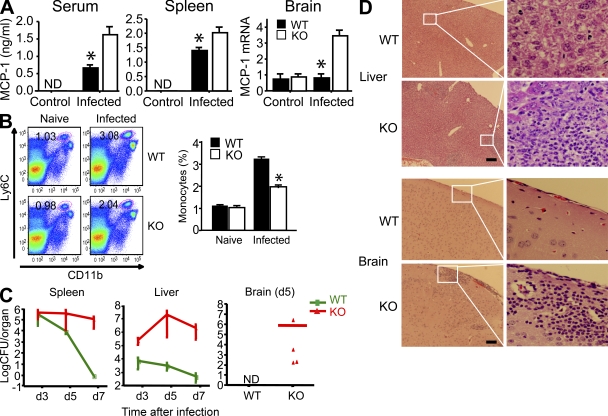
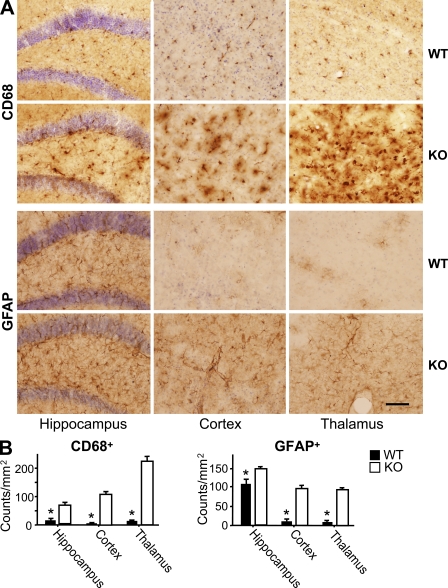
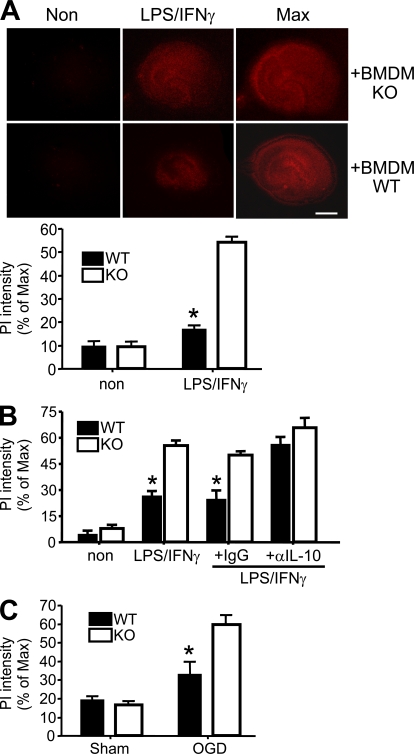
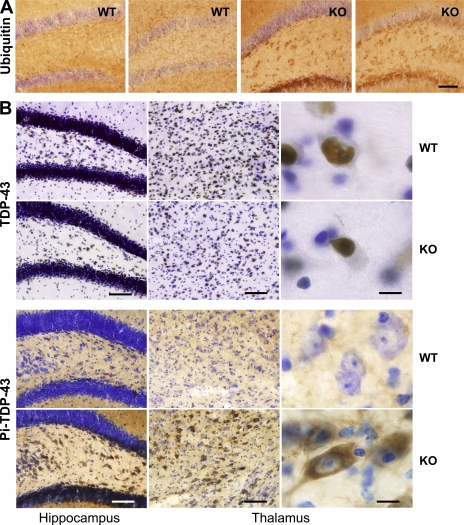
Progranulin (PGRN) is a widely expressed protein involved in diverse biological processes. Haploinsufficiency of PGRN in the human causes tau-negative, ubiquitin-positive frontotemporal dementia (FTD). However, the mechanisms are unknown. To explore the role of PGRN in vivo, we generated PGRN-deficient mice. Macrophages from these mice released less interleukin-10 and more inflammatory cytokines than wild type (WT) when exposed to bacterial lipopolysaccharide. PGRN-deficient mice failed to clear Listeria monocytogenes infection as quickly as WT and allowed bacteria to proliferate in the brain, with correspondingly greater inflammation than in WT. PGRN-deficient macrophages and microglia were cytotoxic to hippocampal cells in vitro, and PGRN-deficient hippocampal slices were hypersusceptible to deprivation of oxygen and glucose. With age, brains of PGRN-deficient mice displayed greater activation of microglia and astrocytes than WT, and their hippocampal and thalamic neurons accumulated cytosolic phosphorylated transactivation response element DNA binding protein-43. Thus, PGRN is a key regulator of inflammation and plays critical roles in both host defense and neuronal integrity. FTD associated with PGRN insufficiency may result from many years of reduced neutrotrophic support together with cumulative damage in association with dysregulated inflammation.


Figures

Figure 1.
Figure 1.
Generation of PGRN-deficient mice. (A) Mouse pgrn locus, targeting vector, and predicted floxed and deleted alleles. Gray boxes denote exons. Sequences are indicated for the neomycin/kanamycin resistance gene (neo/kan; light blue), diphtheria toxin/ampicillin gene (DTX/Amp; pink), LoxP sites (blue triangles), and flippase recombination target sites (red triangles). The red bar marks the 3′ probe. (B) Genotyping of PGRN-deficient mice after crossing PGRN floxed mice with CAG-Cre mice. Genomic DNA was restricted with ScaI for Southern blotting with the 3′ probe. Het, heterozygous; KO, homozygous knockout. (C) PGRN expression monitored by RT-PCR compared with GAPDH as a control (left). Quantification of PGRN transcripts in brain by real-time RT-PCR is shown (right). Results are means ± SEM. B, brain; In, intestine; K, kidney; Li, liver; Sk, skin; Sp, spleen. (D) Hippocampal (top) and cortical (bottom) sections from brains of WT and PGRN-deficient (KO) mice were stained with antibody against PGRN. Bar, 200 µm. (E) Mature BMDMs from 2-mo-old WT or PGRN-deficient mice (KO) were cultured in serum-free media for 48 h. Protein contents of conditioned media were blotted with anti-PGRN (right). Ponceau S staining of the same membrane is shown (left).
Figure 2.
Figure 2.
Dysregulated inflammatory responses of PGRN-deficient macrophages to bacterial endotoxin in vitro. (A) Reduced cytokine expression by PGRN-deficient macrophages in response to LPS. Quantitative RT-PCR at indicated times after exposure to 10 ng/ml LPS is shown. (B) Reduced cytokine release by PGRN-deficient macrophages in response to LPS. ELISAs were done with conditioned media collected 12 or 24 h after adding the indicated concentrations of LPS. (C) Enhanced IL-10 production by PGRN-deficient macrophages in response to LPS. IL-10 induction was determined as in A and B. Results are means ± SEM for triplicates from three to five similar experiments. *, P < 0.05 using the Student’s t test. ND, nondetectable.
Figure 3.
Figure 3.
PGRN restrains macrophage inflammatory responses by synergizing with LPS for induction of IL-10 transcription. (A) Effect of anti–IL-10 antibody on TNF and MCP-1 production from BMDMs. 1 µg/ml anti–IL-10 or control IgG was added together with LPS and cytokines quantitated by ELISA as in Fig. 2 B. Results are expressed as means ± SEM of triplicate samples from one out of four experiments. (B) PGRN regulates IL-10 expression at the transcriptional level. Quantitative RT-PCR for nascent IL-10 transcripts (left) or spliced IL-10 transcripts (right) was measured 1 h after exposure of BMDMs to 100 ng/ml LPS. Results are expressed as means ± SEM of triplicate samples from one out of two independent experiments. (C) Recombinant PGRN synergized with LPS in IL-10 induction. RAW264.7 cells were incubated with the indicated concentrations of LPS and PGRN for 20 h. IL-10 in the conditioned media was measured by ELISA. Results are expressed as means ± SEM of three independent experiments. *, P < 0.05 using the Student’s t test.
Figure 4.
Figure 4.
Defective host defense of PGRN-deficient mice. (A) Enhanced MCP-1 levels in PGRN-deficient mice in response to infection. WT and PGRN-deficient mice (n = 10 per group) were infected intravenously with 3 × 10³ L. monocytogenes. MCP-1 levels in serum and spleen homogenates were determined 24 h after infection by ELISA. Hippocampal expression of MCP-1 was determined by real-time RT-PCR 5 d after infection and expressed as relative levels after normalization with GAPDH mRNA. Results are means ± SEM. *, P < 0.05 using the Student’s t test. ND, nondetectable. (B) Decreased monocyte recruitment to infected spleens of PGRN-deficient mice. Cells from naive or infected spleen (24 h after infection) were tested for the expression of CD11b and Ly6C (for monocyte population). Numbers in dot plots indicate the percentage of Ly6ChiCD11b+ cells. Dot plots are of individual mice; bar graphs represent the mean of five mice per group. Experiments were repeated three times with similar results. *, P < 0.05 using the Student’s t test. (C) Inability to rapidly resolve bacterial infection by PGRN-deficient mice. WT and PGRN-deficient (KO) mice were infected intravenously with 5 × 10³ L. monocytogenes. Bacterial burdens in the spleen, liver, and brain were measured as CFUs at the times indicated (n = 5 per genotype for days 3 and 5 after infection; n = 10 per genotype for day 7 after infection). Results are means ± SEM from one out of three similar experiments. (D) Exaggerated tissue inflammation in PGRN-deficient mice, as assessed by hematoxylin and eosin staining at day 3 (liver) or 5 (brain) after intravenous infection with 5 × 10³ L. monocytogenes. Results are means ± SEM from one out of three similar experiments. Bars, 200 µm.
Figure 5.
Figure 5.
Augmented activation of microglia and astrocytes in the brain of aged PGRN-deficient mice. (A) Activation of microglia and astrocytes in PGRN-deficient mice. Hippocampal, cortical, and thalamic sections from 18-mo-old WT and PGRN-deficient (KO) mice (n = 6) were immunostained using antibody against CD68 or GFAP. (B) Activated CD68+ and GFAP+ cells were expressed as cells per square millimeter within indicated regions of both cerebral hemispheres of each animal. Results are means ± SEM from three independent experiments. *, P < 0.01 using the Student’s t test. Bar, 80 µm.
Figure 6.
Figure 6.
Enhanced neurotoxic potential of PGRN-deficient macrophages and microglia, and increased vulnerability of PGRN-deficient neurons to stress. (A) BMDM-induced cell death in cultured hippocampal slices. WT coronal hippocampal slices were incubated with WT (n = 29) or PGRN-deficient (KO; n = 36) BMDMs with (LPS/IFN-γ) or without (Non) LPS and IFN-γ for 5 d. Cell death was assessed with PI staining. (top) Representative images. (bottom) Quantitative evaluation is expressed as the percentage of PI staining relative to maximal PI staining (Max) induced with 0.1% Triton X-100. The results are means ± SEM from five independent experiments. *, P < 0.001 using the Student’s t test. Bar, 1 mm. (B) Activated microglia-induced cell death in hippocampal slices. Slices (n = 12 per group) from WT or PGRN-deficient mice were incubated with 10 ng/ml GM-CSF (3 d), followed by stimulation with LPS and IFN-γ in the presence of 10 µg/ml anti–IL-10 or control IgG for 3 d. Cell death was measured as in A. The results are means ± SEM from three independent experiments. *, P < 0.002 using the Student’s t test. (C) Effect of OGD on hippocampal slices from PGRN-deficient (KO) and WT mice (n = 6). Slices were cultured for 2 wk, followed by OGD treatment. Neuronal viability was assessed by PI staining before and after OGD. Maximal neuronal death was induced by exposure to 1 mM NMDA after OGD treatment. The results are means ± SEM from three independent experiments. *, P < 0.001 using the Student’s t test.
Figure 7.
Figure 7.
Increased ubiquitination and phosphorylation of TDP-43 in the PGRN-deficient brain. (A) Enhanced ubiquitin immunostaining in the hippocampus of old PGRN-deficient mice. Sections from 18-mo-old WT and PGRN-deficient (KO) mice (n = 5) were stained using antibody against ubiquitin. Representative sections from two different mice in each group are shown. Bar, 80 µm. (B) Phosphorylation of TDP-43 and its cytosolic translocation in aged PGRN-deficient (KO) mice. Hippocampal and thalamic sections from 18-mo-old WT and PGRN-deficient mice (n = 5) were stained with antibodies against TDP-43 (top) or phosphorylated TDP-43 (bottom). Bars: (left and middle) 80 µm; (right) 12 µm.

Similar articles

Cited by

References

    1. Ahmed Z., Mackenzie I.R., Hutton M.L., Dickson D.W. 2007. Progranulin in frontotemporal lobar degeneration and neuroinflammation. J. Neuroinflammation. 4:7 10.1186/1742-2094-4-7 - DOI - PMC - PubMed
    1. Arai T., Hasegawa M., Akiyama H., Ikeda K., Nonaka T., Mori H., Mann D., Tsuchiya K., Yoshida M., Hashizume Y., Oda T. 2006. TDP-43 is a component of ubiquitin-positive tau-negative inclusions in frontotemporal lobar degeneration and amyotrophic lateral sclerosis. Biochem. Biophys. Res. Commun. 351:602–611 10.1016/j.bbrc.2006.10.093 - DOI - PubMed
    1. Björkqvist M., Wild E.J., Thiele J., Silvestroni A., Andre R., Lahiri N., Raibon E., Lee R.V., Benn C.L., Soulet D., et al. 2008. A novel pathogenic pathway of immune activation detectable before clinical onset in Huntington’s disease. J. Exp. Med. 205:1869–1877 10.1084/jem.20080178 - DOI - PMC - PubMed
    1. Cairns N.J., Neumann M., Bigio E.H., Holm I.E., Troost D., Hatanpaa K.J., Foong C., White C.L., III, Schneider J.A., Kretzschmar H.A., et al. 2007. TDP-43 in familial and sporadic frontotemporal lobar degeneration with ubiquitin inclusions. Am. J. Pathol. 171:227–240 10.2353/ajpath.2007.070182 - DOI - PMC - PubMed
    1. Cook C., Zhang Y.J., Xu Y.F., Dickson D.W., Petrucelli L. 2008. TDP-43 in neurodegenerative disorders. Expert Opin. Biol. Ther. 8:969–978 10.1517/14712598.8.7.969 - DOI - PMC - PubMed

Publication types

MeSH terms