. 2010 Mar;184(3):651-8.
doi: 10.1534/genetics.109.109975. Epub 2009 Dec 21.

Regulation by blue light of the fluffy gene encoding a major regulator of conidiation in Neurospora crassa

Affiliations

Regulation by blue light of the fluffy gene encoding a major regulator of conidiation in Neurospora crassa

María Olmedo et al. Genetics. 2010 Mar.

Abstract

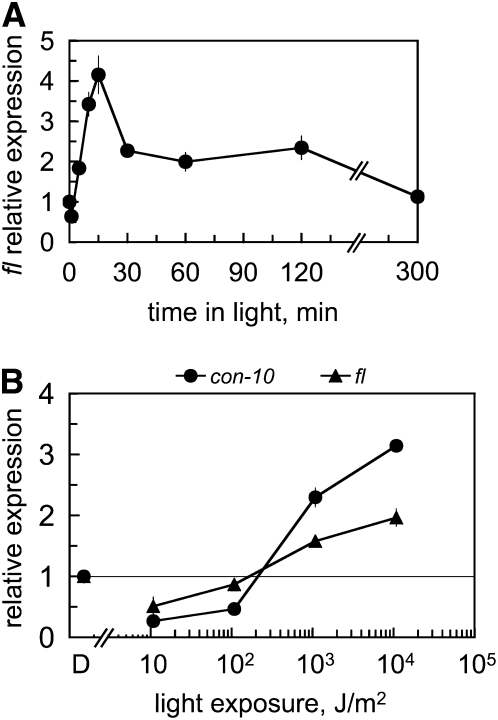
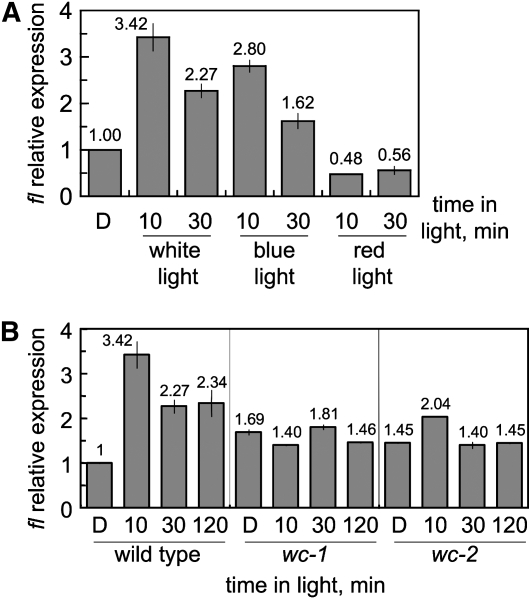
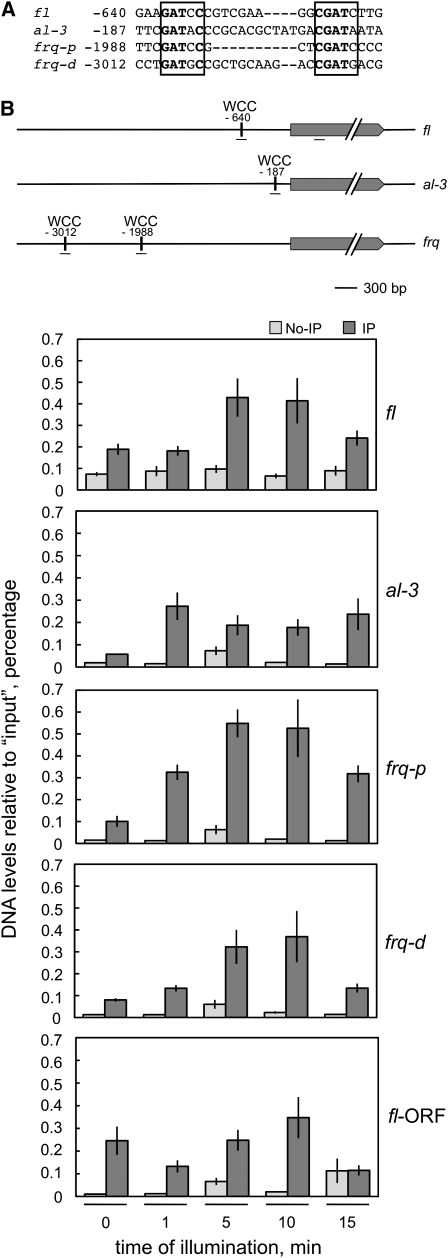
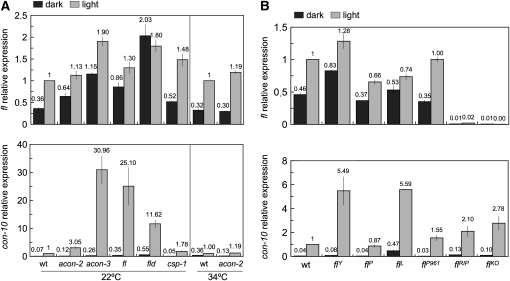
The development of asexual spores, that is, the process of conidiation, in the fungus Neurospora crassa is increased by light. The fluffy (fl) gene, encoding a major regulator of conidiation, is activated by light. We describe here a detailed characterization of the regulation by blue light of fl in vegetative hyphae. This induction requires the white collar complex (WCC) while the FLD protein acts as a dark repressor of fl transcription. We show that the WCC directly regulates fl transcription in response to blue light after transiently binding the promoter. We propose that fl is repressed by FLD in vegetative mycelia and that the repression is lost after light exposure and WCC activation. The increase in fl mRNA in vegetative mycelia after light exposure, and the corresponding increase in the amount of the regulatory FL protein, should promote the activation of the conidiation pathway. The activation by light of fl provides a simple mechanism for the activation of conidiation by blue light in Neurospora that may be at work in other fungi.


Figures

F<sc>igure</sc> 1.—
Figure 1.—
The fl gene is activated by light. (A) Total RNA was isolated from vegetative mycelia of the wild-type strain that had been exposed to white light (the active blue light component was 1 W/m2 blue light) for various periods or kept in the dark (0) prior to RNA isolation. (B) Threshold of gene photoactivation. Wild-type vegetative mycelia were exposed to white light of various intensities for 10 min or kept in the dark (D) prior to RNA isolation. The light exposures used were 1.08 × 10⁴, 1.08 × 10³, and 1.08 × 10² and 10.8 J/m2. A horizontal line is drawn at the position that marks the absence of light-dependent mRNA accumulation (light/dark value equal to 1) to help identify the threshold. The amount of fl, con-10, and tub-2 RNAs were determined by quantitative RT–PCR. Each fluorescent signal was first normalized to the corresponding tub-2 signal to correct for loading errors and then was normalized to the RNA sample from mycelia kept in the dark. The plot shows the average and standard error of the mean of the relative mRNA accumulation in three to nine experiments (A) or in two experiments (B). Each RNA sample was quantified in one PCR experiment.
F<sc>igure</sc> 2.—
Figure 2.—
Activation of fl by blue light and the white collar complex. (A) The fl gene is activated by blue light. Total RNA was isolated from vegetative mycelia of the wild type exposed to white light (16.5 W/m2), blue light (2.6 W/m2), or red light (1.8 W/m2) for 10 or 30 min or kept in the dark (D) prior to RNA isolation. (B) The activation of fl requires the WCC. Total RNA was isolated from vegetative mycelia of the wild type and the wc mutants that had been incubated in the dark for 48 hr (22°C) and exposed to white light during 10, 30, or 120 min or kept in the dark (D) prior to RNA isolation. The amount of fl and tub-2 RNAs were determined by quantitative RT–PCR. Each fluorescent signal was first normalized to the corresponding tub-2 signal to correct for loading errors and then was normalized to the RNA sample from wild-type mycelia kept in the dark. The plot shows the average and standard error of the mean of the relative photoactivation in two to nine experiments (A) or in two experiments (B) except one experiment for the wc strains after 10 or 120 min of light. Each RNA sample was quantified in one PCR experiment.
F<sc>igure</sc> 3.—
Figure 3.—
The WCC binds transiently to the promoter of fl. (A) A putative WCC binding site in the fl promoter. The WCC binding sites in the promoters of the light-regulated genes frq (proximal site, frq-p; distal site, frq-d) and al-3 (in the complementary strand) (He and Liu 2005) are compared to a putative WCC binding site in the fl promoter. Conserved nucleotides are shown in boldface type, and the putative WCC binding sites are boxed. The nucleotide position is shown relative to the initiator ATG. (B) Chromatin immunoprecipation assays. Wild-type mycelia were exposed to white light (the active blue-light component was 1 W/m2 blue light) for the indicated times and chromatin immunoprecipitated with an antibody against WC-2 (IP) or treated without any antibody (no-IP) as a control. After immunoprecipiation, the amount of DNA around the WCC binding site of fl, al-3, frq-p, and frq-d was measured by quantitative PCR and plotted relative to the amount obtained in each corresponding “input” sample. As a control, we assayed the amount of DNA of a segment located within the fl ORF. A scheme showing the relative position of each putative WCC binding site and the corresponding ORF is included. The short horizontal lines under each gene indicate the position of the DNA segments amplified by PCR. The plot shows the average and standard error of the mean in three experiments. Each DNA sample was quantified in three PCR experiments and averaged.
F<sc>igure</sc> 4.—
Figure 4.—
Photoactivation of the fl gene in the wild-type and developmental mutants. Mycelia of the wild-type and developmental mutants (A) or different fl strains (B) were exposed to white light (the active blue-light component was 1 W/m2 blue light) for 10 min or kept in the dark prior to RNA isolation. The amount of fl, con-10, and tub-2 RNAs was determined by quantitative RT–PCR. Each fluorescent signal was first normalized to the corresponding tub-2 signal to correct for loading errors and then was normalized to the signal obtained with the wild-type strain after exposure to light. The plot shows the average and standard error of the mean of the relative photoactivation in six experiments (A) or in two experiments (B). Each RNA sample was quantified in one PCR experiment. The fl strain in A was FGSC 4241.

Similar articles

Cited by

References

    1. Arpaia, G., J. J. Loros, J. C. Dunlap, G. Morelli and G. Macino, 1993. The interplay of light and the circadian clock: independent dual regulation of clock-controlled gene ccg-2(eas). Plant Physiol. 102 1299–1305. - PMC - PubMed
    1. Bailey, L. A., and D. J. Ebbole, 1998. The fluffy gene of Neurospora crassa encodes a Gal4p-type C6 zinc cluster protein required for conidial development. Genetics 148 1813–1820. - PMC - PubMed
    1. Bailey-Shrode, L., and D. J. Ebbole, 2004. The fluffy gene of Neurospora crassa is necessary and sufficient to induce conidiophore development. Genetics 166 1741–1749. - PMC - PubMed
    1. Ballario, P., P. Vittorioso, A. Magrelli, C. Talora, A. Cabibbo et al., 1996. White collar-1, a central regulator of blue light responses in Neurospora, is a zinc finger protein. EMBO J. 15 1650–1657. - PMC - PubMed
    1. Belden, W. J., L. F. Larrondo, A. C. Froehlich, M. Shi, C. H. Chen et al., 2007. a The band mutation in Neurospora crassa is a dominant allele of ras-1 implicating RAS signaling in circadian output. Genes Dev. 21 1494–1505. - PMC - PubMed

Publication types

MeSH terms