

Distributed fading memory for stimulus properties in the primary visual cortex
- PMID: 20027205
- PMCID: PMC2785877
- DOI: 10.1371/journal.pbio.1000260
Distributed fading memory for stimulus properties in the primary visual cortex
Abstract
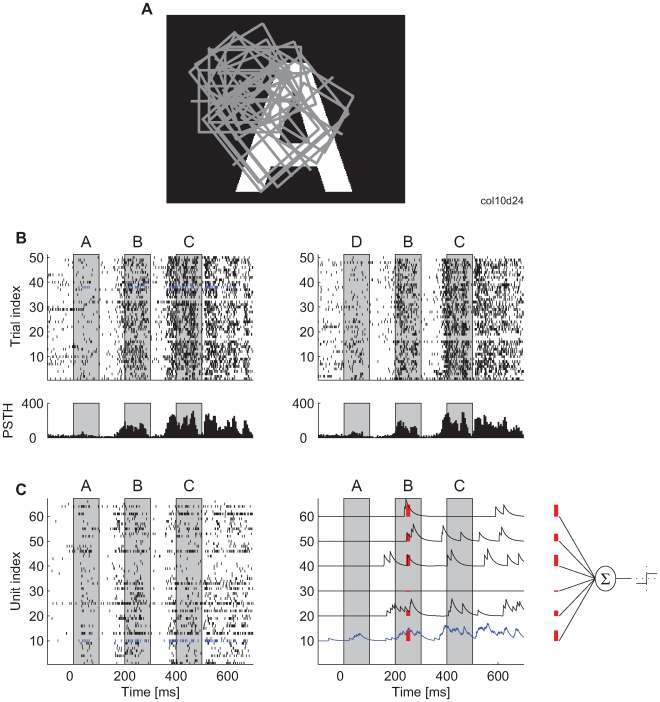
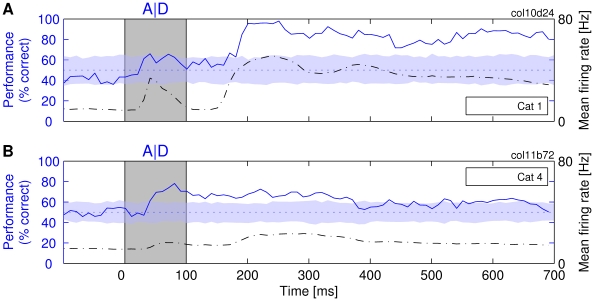
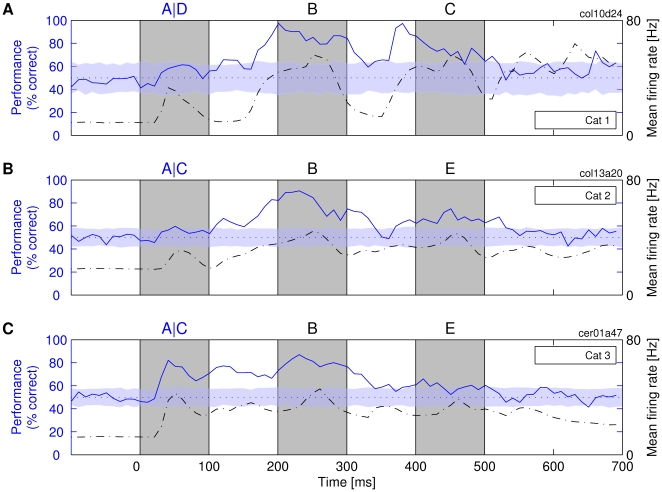
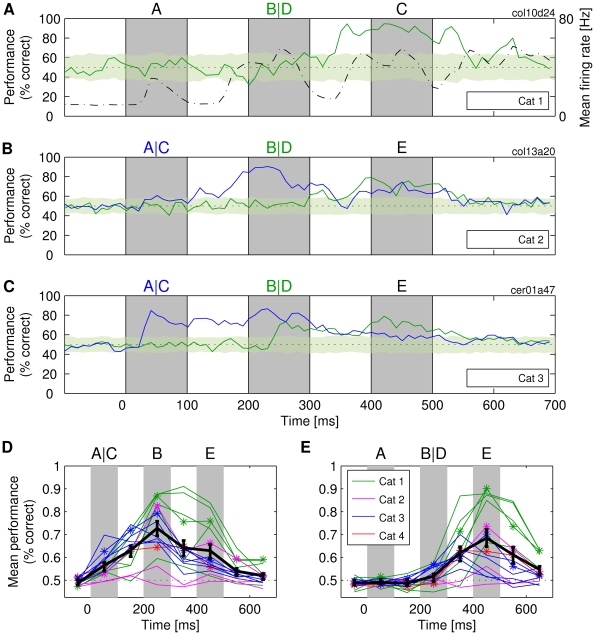
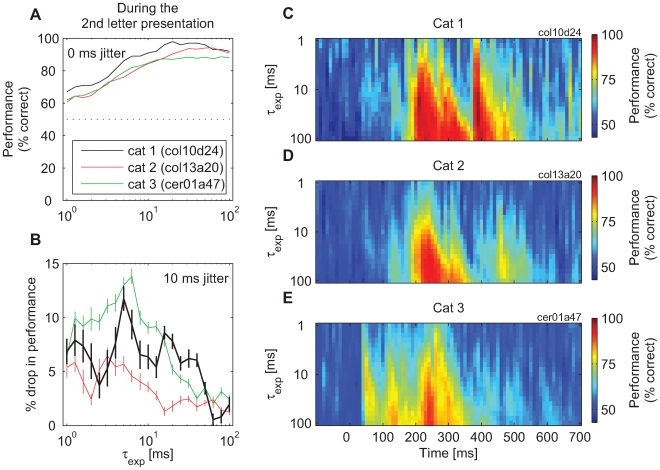
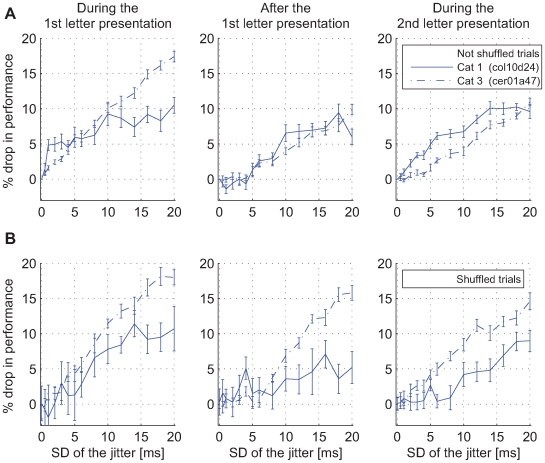
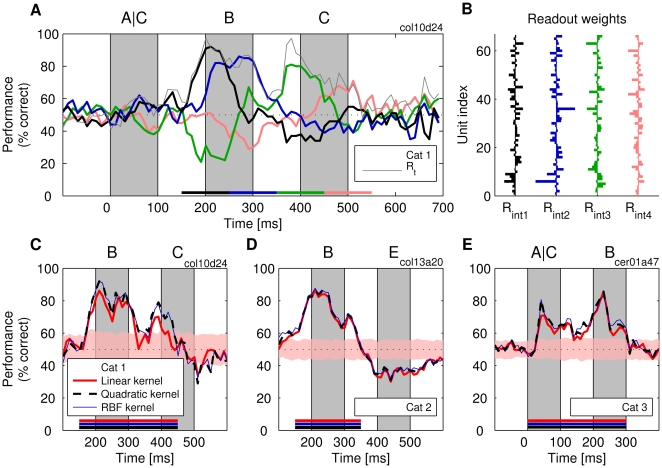
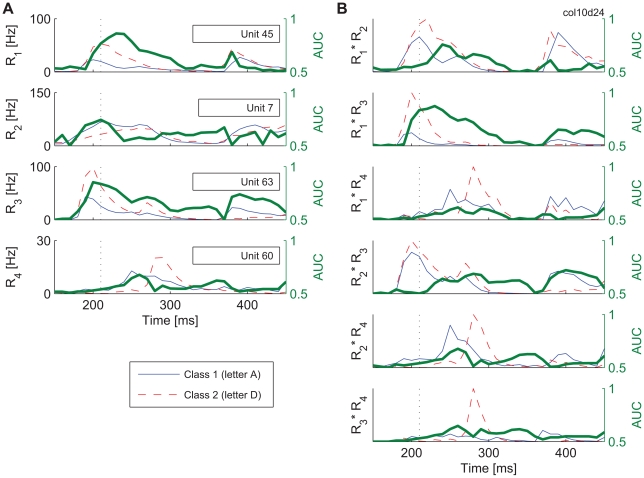
It is currently not known how distributed neuronal responses in early visual areas carry stimulus-related information. We made multielectrode recordings from cat primary visual cortex and applied methods from machine learning in order to analyze the temporal evolution of stimulus-related information in the spiking activity of large ensembles of around 100 neurons. We used sequences of up to three different visual stimuli (letters of the alphabet) presented for 100 ms and with intervals of 100 ms or larger. Most of the information about visual stimuli extractable by sophisticated methods of machine learning, i.e., support vector machines with nonlinear kernel functions, was also extractable by simple linear classification such as can be achieved by individual neurons. New stimuli did not erase information about previous stimuli. The responses to the most recent stimulus contained about equal amounts of information about both this and the preceding stimulus. This information was encoded both in the discharge rates (response amplitudes) of the ensemble of neurons and, when using short time constants for integration (e.g., 20 ms), in the precise timing of individual spikes (<or= approximately 20 ms), and persisted for several 100 ms beyond the offset of stimuli. The results indicate that the network from which we recorded is endowed with fading memory and is capable of performing online computations utilizing information about temporally sequential stimuli. This result challenges models assuming frame-by-frame analyses of sequential inputs.
Conflict of interest statement
The authors have declared that no competing interests exist.
Figures
Similar articles
-
Primate striate and prestriate cortical neurons during discrimination. I. simultaneous temporal encoding of information about color and pattern.J Neurophysiol. 1996 Jan;75(1):481-95. doi: 10.1152/jn.1996.75.1.481. J Neurophysiol. 1996. PMID: 8822572
-
The representational capacity of the distributed encoding of information provided by populations of neurons in primate temporal visual cortex.Exp Brain Res. 1997 Mar;114(1):149-62. doi: 10.1007/pl00005615. Exp Brain Res. 1997. PMID: 9125461
-
Temporal encoding of two-dimensional patterns by single units in primate primary visual cortex. I. Stimulus-response relations.J Neurophysiol. 1990 Aug;64(2):351-69. doi: 10.1152/jn.1990.64.2.351. J Neurophysiol. 1990. PMID: 2213122
-
Pattern separation and synchronization in spiking associative memories and visual areas.Neural Netw. 2001 Jul-Sep;14(6-7):763-80. doi: 10.1016/s0893-6080(01)00084-3. Neural Netw. 2001. PMID: 11665769 Review.
-
Phase correlation among rhythms present at different frequencies: spectral methods, application to microelectrode recordings from visual cortex and functional implications.Int J Psychophysiol. 1997 Jun;26(1-3):171-89. doi: 10.1016/s0167-8760(97)00763-0. Int J Psychophysiol. 1997. PMID: 9203002 Review.
Cited by
-
Minimal approach to neuro-inspired information processing.Front Comput Neurosci. 2015 Jun 2;9:68. doi: 10.3389/fncom.2015.00068. eCollection 2015. Front Comput Neurosci. 2015. PMID: 26082714 Free PMC article. Review.
-
Improved visualization of high-dimensional data using the distance-of-distance transformation.PLoS Comput Biol. 2022 Dec 20;18(12):e1010764. doi: 10.1371/journal.pcbi.1010764. eCollection 2022 Dec. PLoS Comput Biol. 2022. PMID: 36538561 Free PMC article.
-
Perception of the difference between past and present stimulus: A rare orientation illusion may indicate incidental access to prediction error-like signals.PLoS One. 2020 May 4;15(5):e0232349. doi: 10.1371/journal.pone.0232349. eCollection 2020. PLoS One. 2020. PMID: 32365070 Free PMC article.
-
Exploiting short-term memory in soft body dynamics as a computational resource.J R Soc Interface. 2014 Nov 6;11(100):20140437. doi: 10.1098/rsif.2014.0437. J R Soc Interface. 2014. PMID: 25185579 Free PMC article.
-
Recurrent dynamics in the cerebral cortex: Integration of sensory evidence with stored knowledge.Proc Natl Acad Sci U S A. 2021 Aug 17;118(33):e2101043118. doi: 10.1073/pnas.2101043118. Proc Natl Acad Sci U S A. 2021. PMID: 34362837 Free PMC article. Review.
References
-
- Britten K. H, Newsome W. T, Shadlen M. N, Celebrini S, Movshon J. A. A relationship between behavioral choice and the visual responses of neurons in macaque MT. Vis Neurosci. 1996;13:87–100. - PubMed
-
- Biederlack J, Castelo-Branco M, Neuenschwander S, Wheeler D. W, Singer W, et al. Brightness induction: rate enhancement and neuronal synchronization as complementary codes. Neuron. 2006;52:1073–1083. - PubMed
-
- Singer W. Neuronal synchrony: a versatile code for the definition of relations? Neuron. 1999;24:49–65. - PubMed
Publication types
MeSH terms
LinkOut - more resources
Full Text Sources
Other Literature Sources
Medical
Miscellaneous
