Neuropeptide Y knockout mice reveal a central role of NPY in the coordination of bone mass to body weight
- PMID: 20027231
- PMCID: PMC2794533
- DOI: 10.1371/journal.pone.0008415
Neuropeptide Y knockout mice reveal a central role of NPY in the coordination of bone mass to body weight
Abstract
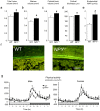
Changes in whole body energy levels are closely linked to alterations in body weight and bone mass. Here, we show that hypothalamic signals contribute to the regulation of bone mass in a manner consistent with the central perception of energy status. Mice lacking neuropeptide Y (NPY), a well-known orexigenic factor whose hypothalamic expression is increased in fasting, have significantly increased bone mass in association with enhanced osteoblast activity and elevated expression of bone osteogenic transcription factors, Runx2 and Osterix. In contrast, wild type and NPY knockout (NPY (-/-)) mice in which NPY is specifically over expressed in the hypothalamus (AAV-NPY+) show a significant reduction in bone mass despite developing an obese phenotype. The AAV-NPY+ induced loss of bone mass is consistent with models known to mimic the central effects of fasting, which also show increased hypothalamic NPY levels. Thus these data indicate that, in addition to well characterized responses to body mass, skeletal tissue also responds to the perception of nutritional status by the hypothalamus independently of body weight. In addition, the reduction in bone mass by AAV NPY+ administration does not completely correct the high bone mass phenotype of NPY (-/-) mice, indicating the possibility that peripheral NPY may also be an important regulator of bone mass. Indeed, we demonstrate the expression of NPY specifically in osteoblasts. In conclusion, these data identifies NPY as a critical integrator of bone homeostatic signals; increasing bone mass during times of obesity when hypothalamic NPY expression levels are low and reducing bone formation to conserve energy under 'starving' conditions, when hypothalamic NPY expression levels are high.
Conflict of interest statement
Figures


Similar articles
-
Hypothalamic control of bone formation: distinct actions of leptin and y2 receptor pathways.J Bone Miner Res. 2005 Oct;20(10):1851-7. doi: 10.1359/JBMR.050523. Epub 2005 May 31. J Bone Miner Res. 2005. PMID: 16160743
-
Neuropeptide Y is a critical modulator of leptin's regulation of cortical bone.J Bone Miner Res. 2013 Apr;28(4):886-98. doi: 10.1002/jbmr.1786. J Bone Miner Res. 2013. PMID: 23044938
-
Central RANK signalling in NPY neurons alters bone mass in male mice.Neuropeptides. 2018 Apr;68:75-83. doi: 10.1016/j.npep.2018.02.004. Epub 2018 Feb 15. Neuropeptides. 2018. PMID: 29477253
-
Central and peripheral mechanisms of the NPY system in the regulation of bone and adipose tissue.Bone. 2012 Feb;50(2):430-6. doi: 10.1016/j.bone.2011.10.001. Epub 2011 Oct 11. Bone. 2012. PMID: 22008645 Review.
-
Osteoblastic Actions of the Neuropeptide Y System to Regulate Bone and Energy Homeostasis.Curr Osteoporos Rep. 2016 Feb;14(1):26-31. doi: 10.1007/s11914-016-0300-9. Curr Osteoporos Rep. 2016. PMID: 26872458 Review.
Cited by
-
Impact of the Autonomic Nervous System on the Skeleton.Physiol Rev. 2018 Jul 1;98(3):1083-1112. doi: 10.1152/physrev.00014.2017. Physiol Rev. 2018. PMID: 29717928 Free PMC article. Review.
-
AgRP1 modulates breeding season-dependent feeding behavior in female medaka.Elife. 2025 May 29;13:RP100996. doi: 10.7554/eLife.100996. Elife. 2025. PMID: 40439220 Free PMC article.
-
Bone-to-Brain: A Round Trip in the Adaptation to Mechanical Stimuli.Front Physiol. 2021 Apr 28;12:623893. doi: 10.3389/fphys.2021.623893. eCollection 2021. Front Physiol. 2021. PMID: 33995117 Free PMC article. Review.
-
Roles of leptin in bone metabolism and bone diseases.J Bone Miner Metab. 2015 Sep;33(5):474-85. doi: 10.1007/s00774-014-0569-7. Epub 2015 Mar 18. J Bone Miner Metab. 2015. PMID: 25777984 Review.
-
High neuropeptide Y release associates with Ewing sarcoma bone dissemination - in vivo model of site-specific metastases.Oncotarget. 2015 Mar 30;6(9):7151-65. doi: 10.18632/oncotarget.3345. Oncotarget. 2015. PMID: 25714031 Free PMC article.
References
-
- Moore RE, Smith CK, Bailey CS, Voelkel EF, Tashjian AH. Characterization of beta-adrenergic receptors on rat and human osteoblast-like cells and demonstration that beta-receptor agonists can stimulate bone resorption in organ culture. Bone Miner. 1993;23:301–315. - PubMed
-
- Kellenberger S, Muller K, Richener H, Bilbe G. Formoterol and isoproterenol induce c-fos gene expression in osteoblast-like cells by activating beta2-adrenergic receptors. Bone. 1998;22:471–478. - PubMed
-
- Takeda S, Elefteriou F, Levasseur R, Liu X, Zhao L, et al. Leptin regulates bone formation via the sympathetic nervous system. Cell. 2002;111:305–317. - PubMed
-
- Stanley BG, Kyrkouli SE, Lampert S, Leibowitz SF. Neuropeptide Y chronically injected into the hypothalamus: a powerful neurochemical inducer of hyperphagia and obesity. Peptides. 1986;7:1189–1192. - PubMed
-
- Erickson JC, Hollopeter G, Palmiter RD. Attenuation of the obesity syndrome of ob/ob mice by the loss of neuropeptide Y. Science. 1996;274:1704–1707. - PubMed
Publication types
MeSH terms
Substances
LinkOut - more resources
Full Text Sources
Other Literature Sources
Medical
Molecular Biology Databases
Miscellaneous

