

Steady-state brain glucose transport kinetics re-evaluated with a four-state conformational model
- PMID: 20027232
- PMCID: PMC2795468
- DOI: 10.3389/neuro.14.006.2009
Steady-state brain glucose transport kinetics re-evaluated with a four-state conformational model
Abstract
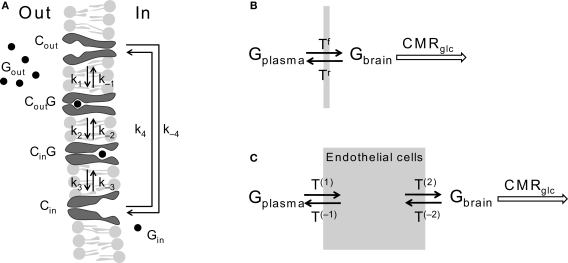
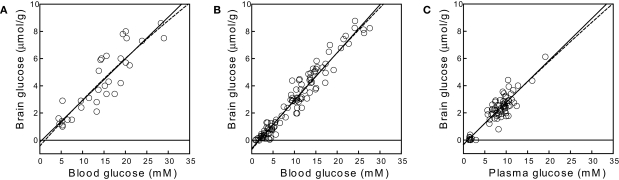
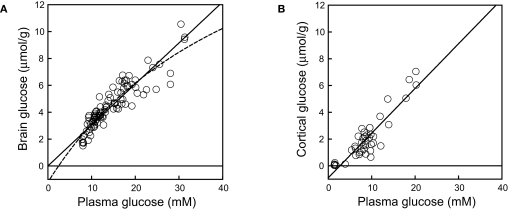
Glucose supply from blood to brain occurs through facilitative transporter proteins. A near linear relation between brain and plasma glucose has been experimentally determined and described by a reversible model of enzyme kinetics. A conformational four-state exchange model accounting for trans-acceleration and asymmetry of the carrier was included in a recently developed multi-compartmental model of glucose transport. Based on this model, we demonstrate that brain glucose (G(brain)) as function of plasma glucose (G(plasma)) can be described by a single analytical equation namely comprising three kinetic compartments: blood, endothelial cells and brain. Transport was described by four parameters: apparent half saturation constant K(t), apparent maximum rate constant T(max), glucose consumption rate CMR(glc), and the iso-inhibition constant K(ii) that suggests G(brain) as inhibitor of the isomerisation of the unloaded carrier. Previous published data, where G(brain) was quantified as a function of plasma glucose by either biochemical methods or NMR spectroscopy, were used to determine the aforementioned kinetic parameters. Glucose transport was characterized by K(t) ranging from 1.5 to 3.5 mM, T(max)/CMR(glc) from 4.6 to 5.6, and K(ii) from 51 to 149 mM. It was noteworthy that K(t) was on the order of a few mM, as previously determined from the reversible model. The conformational four-state exchange model of glucose transport into the brain includes both efflux and transport inhibition by G(brain), predicting that G(brain) eventually approaches a maximum concentration. However, since K(ii) largely exceeds G(plasma), iso-inhibition is unlikely to be of substantial importance for plasma glucose below 25 mM. As a consequence, the reversible model can account for most experimental observations under euglycaemia and moderate cases of hypo- and hyperglycaemia.
Keywords: GLUT; blood-brain-barrier; glucose transport; mathematical modelling.
Figures
Similar articles
-
Characterization of cerebral glucose dynamics in vivo with a four-state conformational model of transport at the blood-brain barrier.J Neurochem. 2012 May;121(3):396-406. doi: 10.1111/j.1471-4159.2012.07688.x. Epub 2012 Mar 14. J Neurochem. 2012. PMID: 22324542
-
Simultaneous measurement of glucose transport and utilization in the human brain.Am J Physiol Endocrinol Metab. 2011 Nov;301(5):E1040-9. doi: 10.1152/ajpendo.00110.2011. Epub 2011 Jul 26. Am J Physiol Endocrinol Metab. 2011. PMID: 21791622 Free PMC article. Clinical Trial.
-
Simultaneous measurement of glucose blood-brain transport constants and metabolic rate in rat brain using in-vivo 1H MRS.J Cereb Blood Flow Metab. 2012 Sep;32(9):1778-87. doi: 10.1038/jcbfm.2012.82. Epub 2012 Jun 20. J Cereb Blood Flow Metab. 2012. PMID: 22714049 Free PMC article.
-
A quantitative overview of glucose dynamics in the gliovascular unit.Glia. 2007 Sep;55(12):1222-1237. doi: 10.1002/glia.20375. Glia. 2007. PMID: 17659523 Review.
-
Structure, function, and regulation of the mammalian facilitative glucose transporter gene family.Annu Rev Nutr. 1996;16:235-56. doi: 10.1146/annurev.nu.16.070196.001315. Annu Rev Nutr. 1996. PMID: 8839927 Review.
Cited by
-
A combined experimental and computational framework to evaluate the behavior of therapeutic cells for peripheral nerve regeneration.Biotechnol Bioeng. 2022 Jul;119(7):1980-1996. doi: 10.1002/bit.28105. Epub 2022 May 2. Biotechnol Bioeng. 2022. PMID: 35445744 Free PMC article.
-
Quantitative in vivo imaging of neuronal glucose concentrations with a genetically encoded fluorescence lifetime sensor.J Neurosci Res. 2019 Aug;97(8):946-960. doi: 10.1002/jnr.24433. Epub 2019 May 20. J Neurosci Res. 2019. PMID: 31106909 Free PMC article.
-
Impact of Caffeine Consumption on Type 2 Diabetes-Induced Spatial Memory Impairment and Neurochemical Alterations in the Hippocampus.Front Neurosci. 2019 Jan 9;12:1015. doi: 10.3389/fnins.2018.01015. eCollection 2018. Front Neurosci. 2019. PMID: 30686981 Free PMC article.
-
Brain Metabolism Alterations in Type 2 Diabetes: What Did We Learn From Diet-Induced Diabetes Models?Front Neurosci. 2020 Mar 20;14:229. doi: 10.3389/fnins.2020.00229. eCollection 2020. Front Neurosci. 2020. PMID: 32265637 Free PMC article. Review.
-
Fueling and imaging brain activation.ASN Neuro. 2012 Jul 20;4(5):e00093. doi: 10.1042/AN20120021. ASN Neuro. 2012. PMID: 22612861 Free PMC article. Review.
References
-
- Betz A. L., Gilboe D. D., Drewes L. R. (1976). The characteristics of glucose transport across the blood brain barrier and its relation to cerebral glucose metabolism. Adv. Exp. Med. Biol. 69, 133–149 - PubMed
-
- Carruthers A. (1990). Facilitated diffusion of glucose. Physiol. Rev. 70, 1135–1176 - PubMed
LinkOut - more resources
Full Text Sources
Research Materials