The Possible Role of CO(2) in Producing A Post-Stimulus CBF and BOLD Undershoot
- PMID: 20027233
- PMCID: PMC2795469
- DOI: 10.3389/neuro.14.007.2009
The Possible Role of CO(2) in Producing A Post-Stimulus CBF and BOLD Undershoot
Abstract
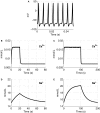
Comprehending the underlying mechanisms of neurovascular coupling is important for understanding the pathogenesis of neurodegenerative diseases related to uncoupling. Moreover, it elucidates the casual relation between the neural signaling and the hemodynamic responses measured with various imaging modalities such as functional magnetic resonance imaging (fMRI). There are mainly two hypotheses concerning this mechanism: a metabolic hypothesis and a neurogenic hypothesis. We have modified recent models of neurovascular coupling adding the effects of both NO (nitric oxide) kinetics, which is a well-known neurogenic vasodilator, and CO(2) kinetics as a metabolic vasodilator. We have also added the Hodgkin-Huxley equations relating the membrane potentials to sodium influx through the membrane. Our results show that the dominant factor in the hemodynamic response is NO, however CO(2) is important in producing a brief post-stimulus undershoot in the blood flow response that in turn modifies the fMRI blood oxygenation level-dependent post-stimulus undershoot. Our results suggest that increased cerebral blood flow during stimulation causes CO(2) washout which then results in a post-stimulus hypocapnia induced vasoconstrictive effect.
Keywords: CMRO2; carbon dioxide; cerebral blood flow; fMRI; nitric oxide; vasodilation.
Figures


Similar articles
-
Post-stimulus fMRI and EEG responses: Evidence for a neuronal origin hypothesised to be inhibitory.Neuroimage. 2017 Aug 15;157:388-399. doi: 10.1016/j.neuroimage.2017.06.020. Epub 2017 Jun 10. Neuroimage. 2017. PMID: 28610902 Free PMC article.
-
Arterial impulse model for the BOLD response to brief neural activation.Neuroimage. 2016 Jan 1;124(Pt A):394-408. doi: 10.1016/j.neuroimage.2015.08.068. Epub 2015 Sep 10. Neuroimage. 2016. PMID: 26363350 Free PMC article.
-
Modeling the impact of neurovascular coupling impairments on BOLD-based functional connectivity at rest.Neuroimage. 2020 Sep;218:116871. doi: 10.1016/j.neuroimage.2020.116871. Epub 2020 Apr 23. Neuroimage. 2020. PMID: 32335261
-
Modeling the hemodynamic response to brain activation.Neuroimage. 2004;23 Suppl 1:S220-33. doi: 10.1016/j.neuroimage.2004.07.013. Neuroimage. 2004. PMID: 15501093 Review.
-
Non-BOLD contrast for laminar fMRI in humans: CBF, CBV, and CMRO2.Neuroimage. 2019 Aug 15;197:742-760. doi: 10.1016/j.neuroimage.2017.07.041. Epub 2017 Jul 20. Neuroimage. 2019. PMID: 28736310 Review.
Cited by
-
The oxygen paradox of neurovascular coupling.J Cereb Blood Flow Metab. 2014 Jan;34(1):19-29. doi: 10.1038/jcbfm.2013.181. Epub 2013 Oct 23. J Cereb Blood Flow Metab. 2014. PMID: 24149931 Free PMC article.
-
Optical measurement of microvascular oxygenation and blood flow responses in awake mouse cortex during functional activation.J Cereb Blood Flow Metab. 2022 Mar;42(3):510-525. doi: 10.1177/0271678X20928011. Epub 2020 Jun 9. J Cereb Blood Flow Metab. 2022. PMID: 32515672 Free PMC article.
-
Relative contribution of cyclooxygenases, epoxyeicosatrienoic acids, and pH to the cerebral blood flow response to vibrissal stimulation.Am J Physiol Heart Circ Physiol. 2012 Mar 1;302(5):H1075-85. doi: 10.1152/ajpheart.00794.2011. Epub 2011 Dec 23. Am J Physiol Heart Circ Physiol. 2012. PMID: 22198176 Free PMC article.
-
A quantitative model for human neurovascular coupling with translated mechanisms from animals.PLoS Comput Biol. 2023 Jan 6;19(1):e1010818. doi: 10.1371/journal.pcbi.1010818. eCollection 2023 Jan. PLoS Comput Biol. 2023. PMID: 36607908 Free PMC article.
-
Cerebral tissue pO2 response to stimulation is preserved with age in awake mice.Neurosci Lett. 2019 Apr 23;699:160-166. doi: 10.1016/j.neulet.2019.02.007. Epub 2019 Feb 7. Neurosci Lett. 2019. PMID: 30738870 Free PMC article.
References
Grants and funding
LinkOut - more resources
Full Text Sources

