

Androgen regulated genes in human prostate xenografts in mice: relation to BPH and prostate cancer
- PMID: 20027305
- PMCID: PMC2793011
- DOI: 10.1371/journal.pone.0008384
Androgen regulated genes in human prostate xenografts in mice: relation to BPH and prostate cancer
Abstract
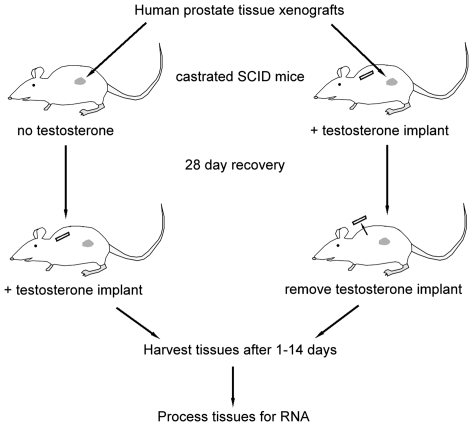
Benign prostatic hyperplasia (BPH) and prostate carcinoma (CaP) are linked to aging and the presence of androgens, suggesting that androgen regulated genes play a major role in these common diseases. Androgen regulation of prostate growth and development depends on the presence of intact epithelial-stromal interactions. Further, the prostatic stroma is implicated in BPH. This suggests that epithelial cell lines are inadequate to identify androgen regulated genes that could contribute to BPH and CaP and which could serve as potential clinical biomarkers. In this study, we used a human prostate xenograft model to define a profile of genes regulated in vivo by androgens, with an emphasis on identifying candidate biomarkers. Benign transition zone (TZ) human prostate tissue from radical prostatectomies was grafted to the sub-renal capsule site of intact or castrated male immunodeficient mice, followed by the removal or addition of androgens, respectively. Microarray analysis of RNA from these tissues was used to identify genes that were; 1) highly expressed in prostate, 2) had significant expression changes in response to androgens, and, 3) encode extracellular proteins. A total of 95 genes meeting these criteria were selected for analysis and validation of expression in patient prostate tissues using quantitative real-time PCR. Expression levels of these genes were measured in pooled RNAs from human prostate tissues with varying severity of BPH pathologic changes and CaP of varying Gleason score. A number of androgen regulated genes were identified. Additionally, a subset of these genes were over-expressed in RNA from clinical BPH tissues, and the levels of many were found to correlate with disease status. Our results demonstrate the feasibility, and some of the problems, of using a mouse xenograft model to characterize the androgen regulated expression profiles of intact human prostate tissues.
Conflict of interest statement
Figures
References
-
- Wei JT, Calhoun E, Jacobsen SJ. Urologic diseases in America project: benign prostatic hyperplasia. J Urol. 2005;173:1256–1261. - PubMed
-
- Isaacs JT, Coffey DS. Etiology and disease process of benign prostatic hyperplasia. Prostate. 1989;Suppl 2:33–50. - PubMed
-
- Lee C, Kozlowski JM, Grayhack JT. Etiology of benign prostatic hyperplasia. Urol Clin North Am. 1995;22:237–246. - PubMed
-
- McNeal JE. Relationship of the origin of benign prostatic hypertrophy to prostatic structure of man and other mammals. In: Hinman FJ, editor. Benign Prostatic Hypertrophy. New York: Springer-Verlag; 1983. pp. 152–166.
Publication types
MeSH terms
Substances
Grants and funding
LinkOut - more resources
Full Text Sources
Medical
Molecular Biology Databases
Miscellaneous
