. 2010 Sep 1;127(5):1081-95.
doi: 10.1002/ijc.25134.

MMP-2 alters VEGF expression via alphaVbeta3 integrin-mediated PI3K/AKT signaling in A549 lung cancer cells

Affiliations

MMP-2 alters VEGF expression via alphaVbeta3 integrin-mediated PI3K/AKT signaling in A549 lung cancer cells

Chandramu Chetty et al. Int J Cancer. .

Abstract

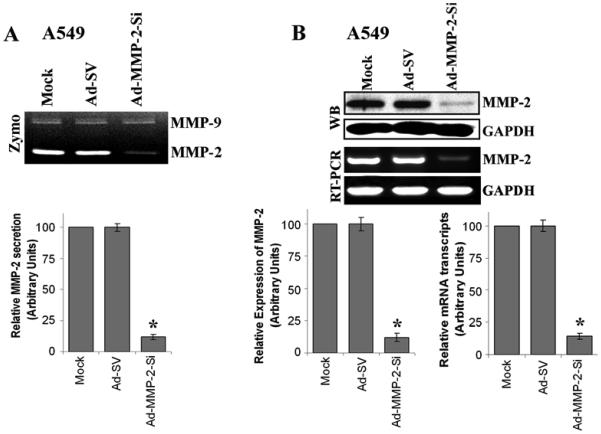
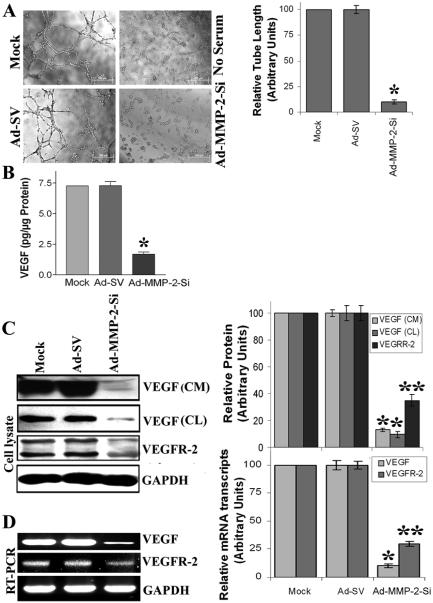
Vascular endothelial growth factor (VEGF) is one of the most important angiogenic growth factors for tumor angiogenesis. Here, we sought to explore whether RNA interference (RNAi) targeting matrix metalloproteinase-2 (MMP-2) could disrupt VEGF-mediated angiogenesis in lung cancer. MMP-2 siRNA inhibited lung cancer cell-induced tube formation of endothelial cells in vitro; addition of recombinant human-MMP-2 restored angiogenesis. MMP-2 transcriptional suppression decreased VEGF, phosphatidylinositol 3-kinase (PI3K) protein levels and AKT phosphorylation in lung cancer cells. In addition, MMP-2 suppression decreased hypoxia inducible factor-1alpha (HIF-1alpha), a transcription factor for VEGF, as determined by electrophoretic mobility shift assay (EMSA). We also show that MMP-2 suppression disrupted PI3K dependent VEGF expression; ectopic expression of myr-AKT restored VEGF inhibition. Further, MMP-2 suppression decreased the interaction of integrin-alphaVbeta3 and MMP-2 as confirmed by immunoprecipitation analyses. Studies with either function blocking integrin-alphaVbeta3 antibody or MMP-2 specific inhibitor (ARP-100) indicate that suppression of MMP-2 decreased integrin-alphaVbeta3-mediated induction of PI3K/AKT leading to decreased VEGF expression. Moreover, A549 xenograft tissue sections from mice that treated with MMP-2 siRNA showed reduced expression of VEGF and the angiogenic marker, factor-VIII. The inhibition of tumor angiogenesis in MMP-2 suppressed tumor sections was associated with decreased co-localization of integrin-alphaVbeta3 and MMP-2. In summary, these data provide new insights into the mechanisms underlying MMP-2-mediated VEGF expression in lung tumor angiogenesis.


Figures

Figure 1
Figure 1. Ad-MMP-2-Si infection inhibits MMP-2 expression in A549 cells
A549 cells were infected as described in Materials and Methods. Briefly, A549 cells were infected with 100 MOI of either Ad-SV or Ad-MMP-2-Si, the medium was aspirated after 36 h of incubation, 3 mL of serum-free medium was added, and cells were incubated overnight. (A) Gelatin zymographic analysis for secreted MMP-2 activity in to the tumor conditioned medium. The gelatinolytic band intensities of MMP-2 were quantified by densitometric analysis using ImageJ software (National Institutes of Health) and normalized with the intensity of the gelatinolytic band in mock-conditioned medium. Columns: mean of triplicate experiments; bars: SE (Standard Error); *p<0.01, significant difference from Ad-SV infected control. (B) Top: Western blot analysis of MMP-2 expression in cell lysates, which were prepared 48 h after Ad-MMP-2-Si infection. The experiments were repeated three times and a representative blot is shown. The blot was stripped and re-probed with GAPDH antibody to detect total amount of the respective proteins. Protein band intensities were quantified by densitometric analysis using ImageJ software (National Institutes of Health). The levels of MMP-2 protein were normalized to protein level in mock infected cells. Columns: mean of triplicate experiments; bars: SE; *p<0.01, significant difference from Ad-SV control. Bottom: Semi-quantitative RT-PCR analysis showing reduced MMP-2 mRNA transcription in Ad-MMP-2-Si-infected cells. Total RNA was extracted, as mentioned in Materials and Methods, from cells infected with mock or 100 MOI of either Ad-SV or Ad-MMP-2-Si, and cDNA was synthesized as described in Materials and Methods. The PCR reaction was set up using the first-stand cDNA as the template for MMP-2. PCR products were resolved on agarose gels and quantified by densitometry using ImageJ software (National Institutes of Health). The level of MMP-2 mRNA transcripts was normalized to the mock infected control product. GAPDH served as a control. Columns: mean of triplicate experiments; bars: SE; *p<0.01, significant difference from Ad-SV control.
Figure 2
Figure 2. Ad-MMP-2-Si inhibits tumor cell conditioned medium-induced angiogenesis in HMEC-1 cells and inhibits VEGF and VEGFR-2 expression in A549 cells
(A) In vitro angiogenesis: A549 cells were infected with mock, Ad-SV or Ad-MMP-2-Si for 36 h, medium was removed, minimum amounts of serum-free medium were added to cover the cells, and cells were incubated for 12 h. Tumor conditioned medium (TCM) was collected and added into 96-well plates, which were coated with Matrigel and seeded with human dermal microvascular endothelial cells-1 (HMEC-1; 2×10⁴ cells/well). After overnight incubation at 37°C, cells were observed under the bright field microscope for formation of capillary-like structures. The degree of angiogenic induction by mock-TCM, Ad-SV-TCM and Ad-MMP-2-Si-TCM was quantified for the numerical value of the product of the relative capillary length per microscopic field. Columns: mean of triplicate experiments; bars: SE; *p<0.01, significant difference from Ad-SV-TCM. (B) Tumor conditioned medium was prepared as described above and ELISA was performed for detection of VEGF-A levels according to the manufacturer's instructions. Quantification of VEGF concentration is shown. Columns: mean of triplicate experiments; bars: SE; *p<0.01, significant difference from Ad-SV control. (C) Western blot analysis of tumor conditioned medium (CM) for VEGF (VEGF-A) protein levels was carried out using a VEGF-specific antibody. For preparation of cell lysates (CL) infected cells were incubated for 48 h as described in Materials and Methods. Western blot analysis of cell lysates for VEGF and VEGFR-2 protein levels was carried out using a VEGF and VEGFR-2 specific antibody. The blots were stripped and re-probed with GAPDH antibody to detect total amounts of the respective proteins. Protein band intensities were quantified by densitometric analysis using ImageJ software (National Institutes of Health). The levels of VEGF and VEGFR-2 proteins were normalized to respective protein level in mock infected A549 cells. Columns: mean of triplicate experiments; bars: SE; *p<0.01 and *p<0.05, significant difference from Ad-SV control. (D) Semi-quantitative RT-PCR analysis showing reduced VEGF and VEGFR-2 mRNA expression in Ad-MMP-2-Si-infected cells. Total RNA was extracted, as described in Materials and Methods, from A549 cells infected with mock or 100 MOI of either Ad-SV or Ad-MMP-2-Si, and cDNA was synthesized as described in Materials and Methods. The PCR reaction was set up using the first-stand cDNA as the template for VEGF and VEGFR-2. PCR products were resolved on agarose gels and quantified by densitometry using ImageJ software (National Institutes of Health). The levels of VEGF and VEGFR-2 mRNA transcripts were normalized to the mock infected control product. GAPDH served as a control. Columns: mean of triplicate experiments; bars: SE; *p<0.01 and **p<0.05, significant difference from Ad-SV control.
Figure 3
Figure 3. Ad-MMP-2-Si inhibits HIF-1α expression in A549 cells
A549 cells were infected with mock, Ad-SV or Ad-MMP-2-Si for 36 h, medium was removed, minimum amounts of serum-free medium were added to cover the cells, and cells were incubated at 1.0% O2 for 12 h. Finally, we collected the conditioned medium and the cells. (A) Cell lysates were used for western blot analysis for HIF-1α expression using a HIF-1α-specific antibody. The experiments were carried out three times and a representative western blot is shown. The blots were stripped and re-probed with GAPDH antibody to detect total amounts of the respective proteins. Protein band intensities were quantified by densitometric analysis using ImageJ software (National Institutes of Health). The levels of HIF-1α protein were normalized to protein level in mock infected A549 cells. Columns: mean of triplicate experiments; bars: SE; *p<0.01, significant difference from Ad-SV control. (B) Semi-quantitative reverse transcription-PCR analysis showing reduced HIF-1α mRNA expression in Ad-MMP-2-Si-infected cells. Total RNA was extracted, as described in Materials and Methods, from A549 cells infected with mock or 100 MOI of either Ad-SV or Ad-MMP-2-Si, and cDNA was synthesized as described in Materials and Methods. The PCR reaction was set up using the first-stand cDNA as the template for HIF-1α. GAPDH served as a control. PCR products were resolved on agarose gels and quantified by densitometry using ImageJ software (National Institutes of Health). The level of HIF-1α mRNA transcripts was normalized to the mock infected control product. GAPDH served as a control. Columns: mean of triplicate experiments; bars: SE; *p<0.01 significant difference from Ad-SV controls. (C) A549 cells were infected as described above and nuclear extracts prepared as described in Materials and Methods. Nuclear protein (5 μg) was subjected to EMSA for HIF-1α binding to its consensus sequence.
Figure 4
Figure 4. Ad-MMP-2-Si inhibits PI3K/AKT-mediated VEGF expression in A549 cells
(A) A549 cells were infected with mock or 100 MOI of either Ad-SV or Ad-MMP-2-Si for 48 h and cell lysates western blotted for PI3K, AKT and phosphorylated-AKT (Ser-473) using specific antibodies. The experiments were carried out three times and representative western blots are shown. The blots were stripped and re-probed with GAPDH antibody to detect total amounts of the respective proteins. Protein band intensities were quantified by densitometric analysis using ImageJ software (National Institutes of Health). The levels of PI3K and phospho-AKT (Ser-473) proteins were normalized to respective protein level in mock infected A549 cells. Columns: mean of triplicate experiments; bars: SE; *p<0.01, significant difference from Ad-SV control. (B) A549 cells were transfected with a plasmid expressing constitutively active AKT (myr-AKT) 24 h before Ad-MMP-2-Si infection. We then performed western blot analysis for VEGF levels in tumor conditioned medium (CM) and VEGF, AKT and phosphorylated-AKT (Ser-473) levels in cell lysates (CL) using specific antibodies. Protein band intensities were quantified by densitometric analysis using ImageJ software (National Institutes of Health). The levels of VEGF and phospho-AKT (Ser-473) proteins were normalized to respective protein level in mock infected A549 cells. Columns: mean of triplicate experiments; bars: SE; *p<0.01, significant difference from Ad-SV control; **p<0.01, significant difference from Ad-MMP-2-Si infection alone. (C) A549 cells were transfected with a plasmid expressing constitutively active AKT (myr-AKT) 24 h before Ad-MMP-2-Si infection. After 24 h of Ad-MMP-2-Si infection, recombinant human MMP-2 (25 ng/mL) or recombinant human VEGF (25 nM) was added to A549 cells. Cells were incubated for 12 h, the medium was aspirated, cells were washed with PBS three times, a minimum amount of serum-free medium was added, and cells were incubated for another 12 h. An in vitro angiogenic assay was performed under the same conditions as described in Figure 2. The experiments were carried out three times, and representative pictures are shown. The degree of angiogenic induction was quantified for the numerical value of the product of the relative capillary length per microscopic field. Columns: mean of quadruplicate experiments; bars: SE; **p<0.01, significant difference from respective Ad-SV infected control; *p<0.01, significant difference from respective Ad-MMP-2-Si infection alone.
Figure 5
Figure 5. Recombinant human-MMP-2 inhibits Ad-MMP-2-Si-inhibited PI3K, phosphorylation of AKT and VEGF expression in lung adenocarcinoma cells
(A & B) After 24 h of Ad-MMP-2-Si infection, A549/H1299 cells were incubated with rhMMP-2 (25 ng/mL) for 12 h and the medium was aspirated, cells were washed with PBS three times, a minimum amount of serum-free medium was added, and cells were incubated for another 12 h. We then performed western blot analysis for VEGF in conditioned medium (CM) and expression of PI3K, phosphorylated-AKT (Ser-473), VEGF and VEGFR-2 in cell lysates (CL). Protein band intensities were quantified by densitometric analysis using ImageJ software (National Institutes of Health). The levels of PI3K, phospho-AKT (Ser-473) and VEGF proteins were normalized to respective protein level in mock infected cells. Columns: mean of triplicate experiments; **p<0.01, significant difference from Ad-SV control; *p<0.05 significant difference from Ad-MMP-2-Si infection.
Figure 6
Figure 6. Inhibition of MMP-2 inhibits integrin-αVβ3-mediated VEGF expression in A549 cells
(A) A549 cells were plated in 8-well chamber slides and infected with mock or 100 MOI of either Ad-SV or Ad-MMP-2-Si for 48 h. Immunocytochemistry was performed for co-localization (yellow) of MMP-2 (green) and integrin-αVβ3 (Red) using specific antibodies. (B) A549 cells were infected with mock or 100 MOI of either Ad-SV or Ad-MMP-2-Si for 48 h, and proteins were immunoprecipitated with an anti-integrin-αVβ3 antibody. Western blot analysis was performed for MMP-2 using immunoprecipitated proteins. Protein band intensities were quantified by densitometric analysis using ImageJ software (National Institutes of Health). The levels of MMP-2 protein were normalized to protein level in mock infected A549 cells. Columns: mean of triplicate experiments; *p<0.01, significant difference from Ad-SV control. (C) After 36 h of Ad-MMP-2-Si infection, A549 cells were incubated with a MMP-2 specific inhibitor (ARP-100; at a concentration of 50 and 100 μM) for 12 h. Proteins were immunoprecipitated with anti-integrin-αVβ3 antibody and performed gelatin zymography and western blot for MMP-2. Columns: mean of triplicate experiments; *p<0.01, significant difference from Ad-SV/solvent control. (D) After 24 h of Ad-MMP-2-Si infection, A549 cells were incubated with rhMMP-2 (25 ng/mL) for 24 h. Gelatin zymography and western blot analysis was performed for MMP-2 from immunoprecipitated protein samples with an anti-integrin-αVβ3 antibody. Protein band intensities were quantified by densitometric analysis using ImageJ software (National Institutes of Health). The levels of MMP-2 protein were normalized to protein level in mock infected A549 cells. Columns: mean of triplicate experiments; *p<0.01, significant difference from Ad-SV control; **p<0.01 significant difference from Ad-MMP-2-Si infection. (E) After 24 h of Ad-MMP-2-Si infection, A549 cells were incubated with rhMMP-2 (25 ng/mL), non-specific IgG and/or anti-integrin-αVβ3 antibodies for another 24 h. We then performed western blot analyses for PI3K, phosphorylation of AKT and VEGF levels using total lysates. GAPDH served as a loading control. Protein band intensities were quantified by densitometric analysis using ImageJ software (National Institutes of Health). The levels of PI3K, phospho-AKT (Ser-473) and VEGF proteins were normalized to respective protein level in mock infected A549 cells. Columns: mean of triplicate experiments; *p<0.01, significant difference from Ad-SV infected control; **p<0.05 significant difference from Ad-SV plus integrin-αVβ3 blocking antibody treatment.
Figure 7
Figure 7. MMP-2 inhibition using Ad-MMP-2-Si decreased angiogenesis, VEGF expression, and co-localization of MMP-2 and integrin-αVβ3 in A549 lung tumors in vivo
H&E staining was performed as per standard protocol and representative pictures (400 X magnifications) of tumor sections from mock, Ad-SV and Ad-MMP-2-Si-treated mice were shown. Immunohistochemistry was performed for expression and co-localization (yellow) of MMP-2 (green) and integrin-αVβ3 (Red) using specific antibodies. Also showed immunohistochemical analysis for anti-Human Von-Willebrand Factor (Factor-VIII) and VEGF expression using specific antibodies. Data shown are representative fields (400 X magnifications). Also shown is the negative control where the primary antibody was replaced by non-immune serum (inserts).
Scheme 1
Scheme 1. MMP-2 interaction with integrin-αVβ3 induces PI3K/AKT-mediated VEGF expression resulting in angiogenesis
MMP-2 siRNA inhibits PI3K/AKT-mediated VEGF expression resulting in decreased angiogenesis.

Similar articles

Cited by

References

    1. Folkman J. Angiogenesis. Annu Rev Med. 2006;57:1–18. - PubMed
    1. Bergers G, Benjamin LE. Tumorigenesis and the angiogenic switch. Nat Rev Cancer. 2003;3:401–10. - PubMed
    1. Kalluri R. Basement membranes: structure, assembly and role in tumour angiogenesis. Nat Rev Cancer. 2003;3:422–33. - PubMed
    1. McMahon G. VEGF receptor signaling in tumor angiogenesis. Oncologist. 2000;5(Suppl 1):3–10. - PubMed
    1. Banerjee SN, Sengupta K, Banerjee S, Saxena NK, Banerjee SK. 2-Methoxyestradiol exhibits a biphasic effect on VEGF-A in tumor cells and upregulation is mediated through ER-alpha: a possible signaling pathway associated with the impact of 2-ME2 on proliferative cells. Neoplasia. 2003;5:417–26. - PMC - PubMed

Publication types

MeSH terms