. 2010 May;22(5):1312-32.
doi: 10.1162/neco.2009.04-09-999.

Representation sharpening can explain perceptual priming

Affiliations

Representation sharpening can explain perceptual priming

Samat Moldakarimov et al. Neural Comput. 2010 May.

Abstract

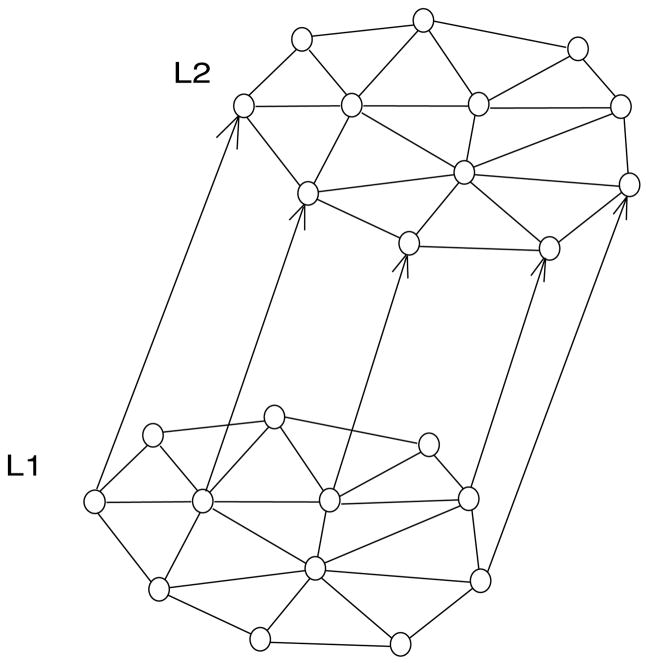
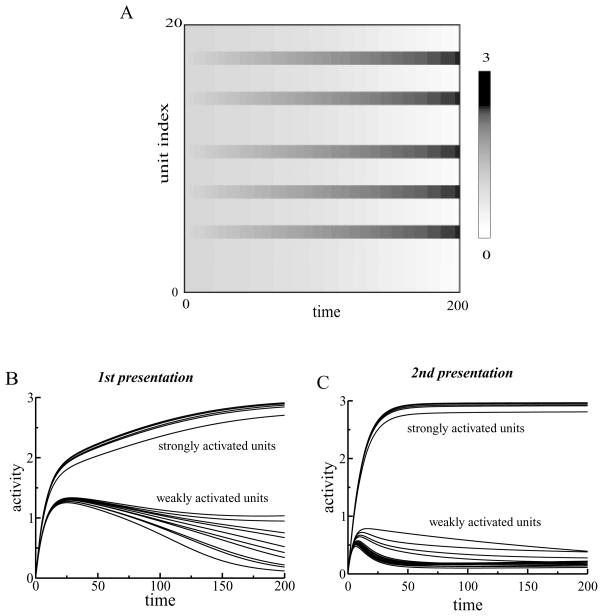
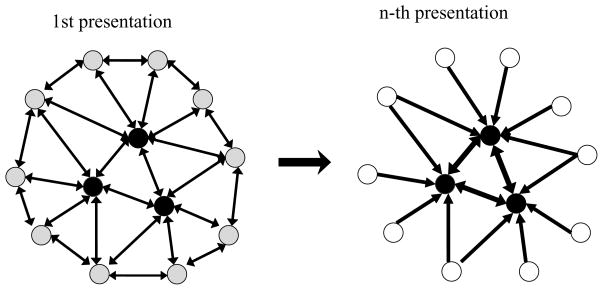
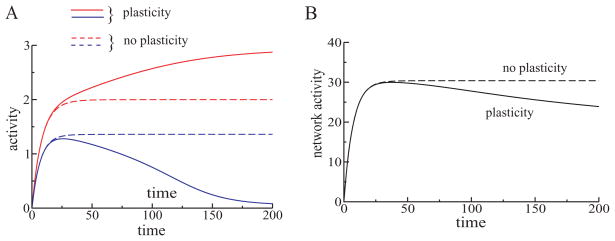
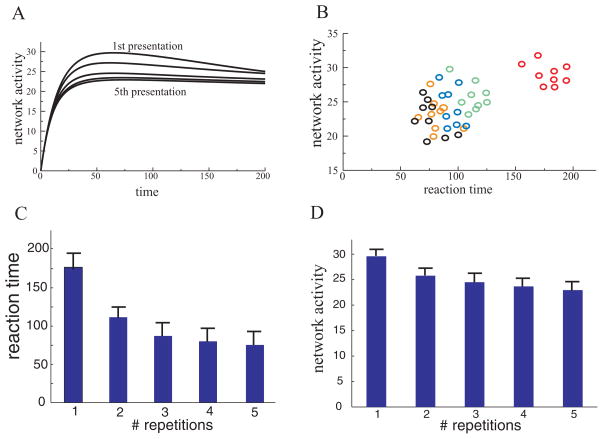
Perceiving and identifying an object is improved by prior exposure to the object. This perceptual priming phenomenon is accompanied by reduced neural activity. But whether suppression of neuronal activity with priming is responsible for the improvement in perception is unclear. To address this problem, we developed a rate-based network model of visual processing. In the model, decreased neural activity following priming was due to stimulus-specific sharpening of representations taking place in the early visual areas. Representation sharpening led to decreased interference of representations in higher visual areas that facilitated selection of one of the competing representations, thereby improving recognition. The model explained a wide range of psychophysical and physiological data observed in priming experiments, including antipriming phenomena, and predicted two functionally distinct stages of visual processing.


Figures

Figure 1
Figure 1
Two-layer network model. Each layer consisted of 20 units. Layer 1 (L1) corresponded to an early visual area. The units in L1 were connected through all-to-all excitatory connections. The excitatory connections were plastic and adjusted according to a Hebbian learning rule. There were also fixed uniform all-to-all inhibitory connections of moderate strengths (not shown). Layer 2 (L2) in the model corresponded to a higher visual area or prefrontal cortex (PFC). Units in L2 received fixed (nonadjustable) feedforward inputs from units in L1 and also received fixed (nonadjustable), strong, recurrent all-to-all inhibitory connections from other units in L2. Units in L2 network displayed the dynamics of a winner-take-all network. Because of the strong mutual inhibition, eventually only one unit survived the competition and suppressed the other units.
Figure 2
Figure 2
(A) Dynamics of the activity levels of L1 units. External inputs were randomly chosen. Five units received stronger inputs (mean = 7) than other units (mean = 5). The activities of those five units increased with time, while the activities of the other units decreased. (B) Dynamics of L1 units during the first presentation of a stimulus. After a rapid increase in activity, the units separated into two groups. The activities of units receiving stronger inputs continued to increase, while the activities of weakly activated units decreased. (C) Dynamics of L1 units during the second presentation of the stimulus. The two groups of units separated earlier for the repeated presentation of the stimulus.
Figure 3
Figure 3
Illustration of representation sharpening in L1. (Left) Initial stimulus presentation activated a pattern of activity of the units in L1 that were activated to varying degrees. Darker filled circles indicate higher activity levels. Strengths of connections are indicated by the thickness of lines connecting the units. For clarity, we illustrate reciprocal connections as one line with two arrowheads, indicating two synapses. (Right) With stimulus repetition, connections between strongly activated units were strengthened, and connections from strongly responding units to weakly active units and between weakly active units were weakened and eventually silenced. This resulted in representation sharpening: only the most active units remained in the representation, and weakly responding units were eliminated from the representation of the stimulus.
Figure 4
Figure 4
(A) Representation sharpening in L1 in the rate model was due to plasticity in the excitatory recurrent connections. Dynamics of activity of one strongly responding unit (red curves) and a weakly responding unit (blue curves) were different with synaptic plasticity (solid curves) and without plasticity (dashed curves) in recurrent excitatory connections. If the recurrent excitatory connections were adjustable, there was a monotonic separation between activities of L1 units; the stronger unit increased its activity with time, while the weaker unit decreased its activity (solid curves). However, without plasticity in the excitatory recurrent connections (learning rate α = 0), the units quickly reached their steady states and remained there for the rest of the stimulus presentation (dashed curves). The difference in the steady-state activity levels was a consequence of different input strengths. (B) Dynamics of the total activity of L1 network (sum of activities of L1 units) with and without plasticity in the recurrent excitatory connections. Although the strong units increased their activities with repetition, the total activity of L1 units decreased with time, when plasticity was present (black solid line). This was because only a few units became stronger, and many more units decreased their activity. Without plasticity in the recurrent connections, the total activity did not decrease but instead reached a steady state (black dashed line).
Figure 5
Figure 5
Decrease of the total activity of the L1 network (sum of activities of L1 units) as a function of differences between inputs to stronger and weaker units. A bigger difference between inputs to strongly activated and weakly activated units led to bigger neural suppression. But this dependence worked only above a certain threshold. We checked this dependence for two strengths of inhibition: parameter b = 0.27 (rectangular) and b = 0.2 (triangular symbols). Input to weaker units was I = 5, and inputs to stronger inputs were varied.
Figure 6
Figure 6
Dynamics of the total activity of L1 network (sum of activities of L1 units) for different strengths of the inhibitory connections. When inhibition was weak (b = 0.1), the total activity of the network was high (highest line), and with strong inhibition (b = 0.7), the total activity was low (lowest line). However, for all values of the inhibitory strengths, the total activity decreased with time, which was a consequence of neural suppression in L1.
Figure 7
Figure 7
(A) A stimulus presented to the network resulted in competition between L2 units, until one of them (red solid line) suppressed the other units and reached a threshold indicating perception (black dashed line). (B) Second presentation of the same stimulus resulted in faster competition among units; the winning unit suppressed the other units and reached the threshold in less time.
Figure 8
Figure 8
(A) Stimulus specificity of neural suppression. The dynamics of the total activity of the L1 units is shown for the first presentation of stimulus A (solid line), for the second presentation of the same stimulus A (dashed line), and when in the second presentation stimulus B was different than it was in the first presentation (dash-dotted line). (B) Suppression of a single neuron’s activity was more stimulus specific than the neuron’s response. One unit in L1 responded well to two different stimuli, A and B. Suppression of the neuron’s activity to the second presentation of stimulus A (AA) was stronger compared to stimulus B presented after stimulus A (AB). (C) Antipriming phenomenon in a winning unit from L2. When stimulus A was presented twice (AA), the reaction time in the model decreased (priming). But when stimulus A was presented after stimulus B, whose representation overlapped with the representation of the stimulus A (BA), the reaction time increased (antipriming) compared to the initial reaction time (stimulus A alone).
Figure 9
Figure 9
(A) The network activity monotonically decreased during repeated presentation of the same stimulus. (B) Robustness of the priming effect. Nine stimuli were presented to the network five times each. Each red circle indicates the first presentation of stimuli, and each green, blue, orange, and black circle is a second, third, fourth, and fifth presentation, respectively. The stimuli varied in size of the input pattern, location, strength of inhibition, strengths of inputs, and so forth. For all stimuli, both reaction time and the total network activity decreased with repetition. (C) The reaction time (time for the winning unit to reach a threshold) decreased monotonically with stimulus repetition (the mean reaction times were 177, 108, 89, 81, and 77 with SD 16, 10, 11, 12, 12, respectively). (D) Total activity of the L1 network measured at the end of the stimulus presentation also decreased (mean total activity was 29, 26, 24, 23, 22.5 with SD 1.6, 2.3, 3.2, 3, 2.9, respectively).

Similar articles

Cited by

References

    1. Blake R, Logothetis NK. Visual competition. Nat Rev Neurosci. 2001;3:1–11. - PubMed
    1. Bogacz R, Brown MW. Comparison of computational models of familiarity discrimination in the perirhinal cortex. Hippocampus. 2003;13:494–524. - PubMed
    1. Desimone R. Neural mechanisms for visual memory and their role in attention. Proc Natl Acad Sci USA. 1996;93:13494–13499. - PMC - PubMed
    1. Foeller E, Feldman DE. Synaptic basis for developmental plasticity in somatosensory cortex. Curr Opin Neurobiol. 2004;14:89–95. - PubMed
    1. Freedman DJ, Riesenhuber M, Poggio T, Miller EK. Experience-dependent sharpening of visual shape selectivity in inferior temporal cortex. Cereb Cortex. 2006;16:1631–1644. - PubMed

Publication types