

cAMP analogs and their metabolites enhance TREK-1 mRNA and K+ current expression in adrenocortical cells
- PMID: 20028740
- PMCID: PMC2835421
- DOI: 10.1124/mol.109.061861
cAMP analogs and their metabolites enhance TREK-1 mRNA and K+ current expression in adrenocortical cells
Abstract
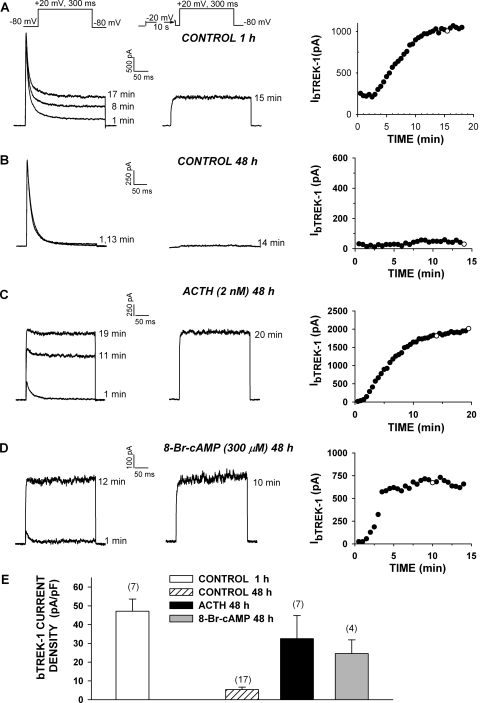
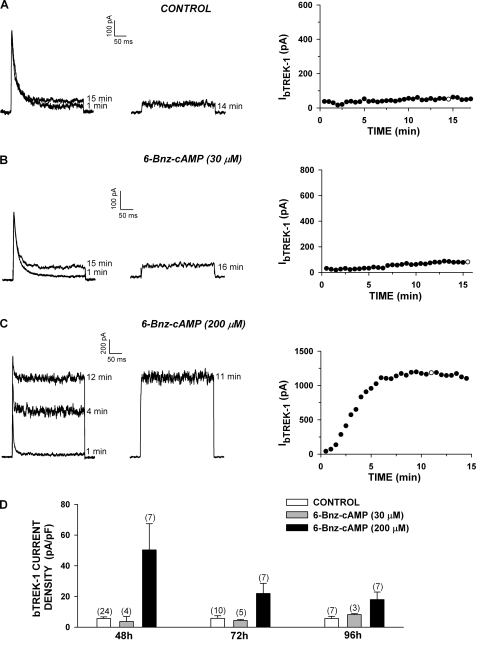
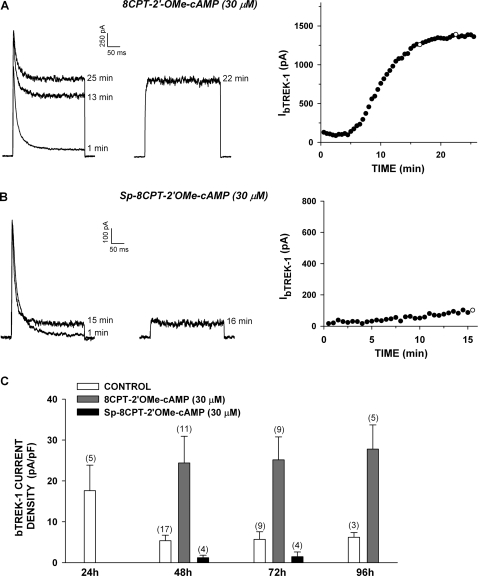
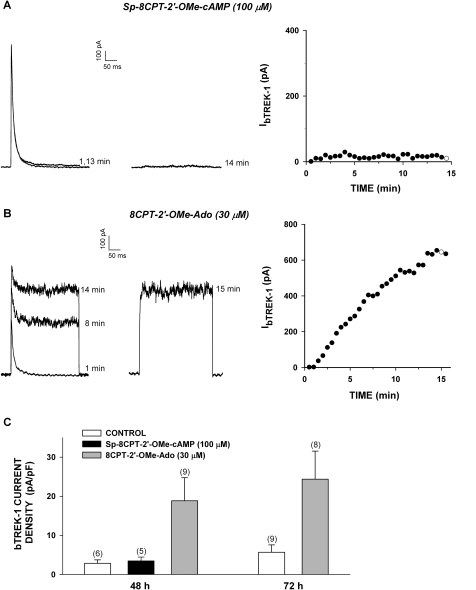
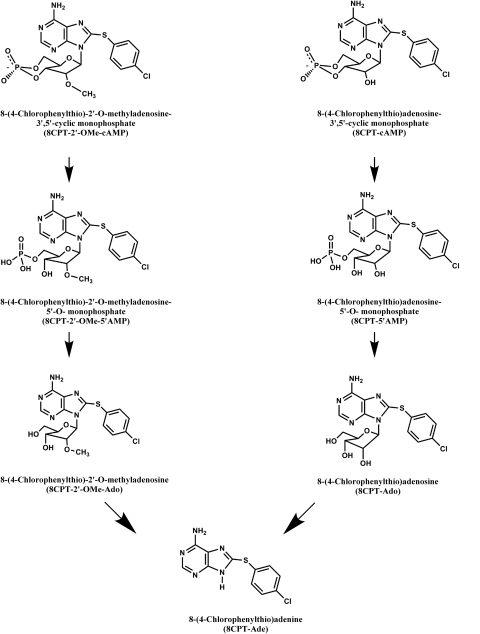
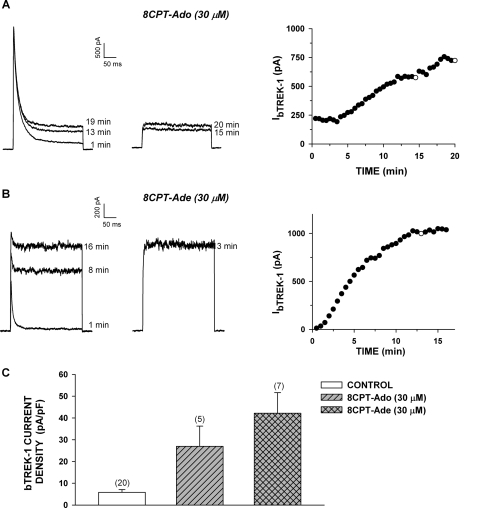
bTREK-1 K(+) channels set the resting membrane potential of bovine adrenal zona fasciculata (AZF) cells and function pivotally in the physiology of cortisol secretion. Adrenocorticotropic hormone controls the function and expression of bTREK-1 channels through signaling mechanisms that may involve cAMP and downstream effectors including protein kinase A (PKA) and exchange protein 2 directly activated by cAMP (Epac2). Using patch-clamp and Northern blot analysis, we explored the regulation of bTREK-1 mRNA and K(+) current expression by cAMP analogs and several of their putative metabolites in bovine AZF cells. At concentrations sufficient to activate both PKA and Epac2, 8-bromoadenosine-cAMP enhanced the expression of both bTREK-1 mRNA and K(+) current. N(6)-Benzoyladenosine-cAMP, which activates PKA but not Epac, also enhanced the expression of bTREK-1 mRNA and K(+) current measured at times from 24 to 96 h. An Epac-selective cAMP analog, 8-(4-chlorophenylthio)-2'-O-methyl-cAMP (8CPT-2'-OMe-cAMP), potently stimulated bTREK-1 mRNA and K(+) current expression, whereas the nonhydrolyzable Epac activator 8-(4-chlorophenylthio)-2'-O-methyl-cAMP, Sp-isomer was ineffective. Metabolites of 8CPT-2'-OMe-cAMP, including 8-(4-chlorophenylthio)-2'-O-methyladenosine-5'-O-monophosphate and 8CPT-2'-OMe-adenosine, promoted the expression of bTREK-1 transcripts and ion current with a temporal pattern, potency, and effectiveness resembling that of the parent compound. Likewise, at low concentrations, 8-(4-chlorophenylthio)-cAMP (8CPT-cAMP; 30 microM) but not its nonhydrolyzable analog 8-(4-chlorophenylthio)-cAMP, Sp-isomer, enhanced the expression of bTREK-1 mRNA and current. 8CPT-cAMP metabolites, including 8CPT-adenosine and 8CPT-adenine, also increased bTREK-1 expression. These results indicate that cAMP increases the expression of bTREK-1 mRNA and K(+) current through a cAMP-dependent but Epac2-independent mechanism. They further demonstrate that one or more metabolites of 8-(4-chlorophenylthio)-cAMP analogs potently stimulate bTREK-1 expression by activation of a novel cAMP-independent mechanism. These findings raise significant questions regarding the specificity of 8-(4-chlorophenylthio)-cAMP analogs as cAMP mimetics.
Figures
 ) for 48 h before isolating
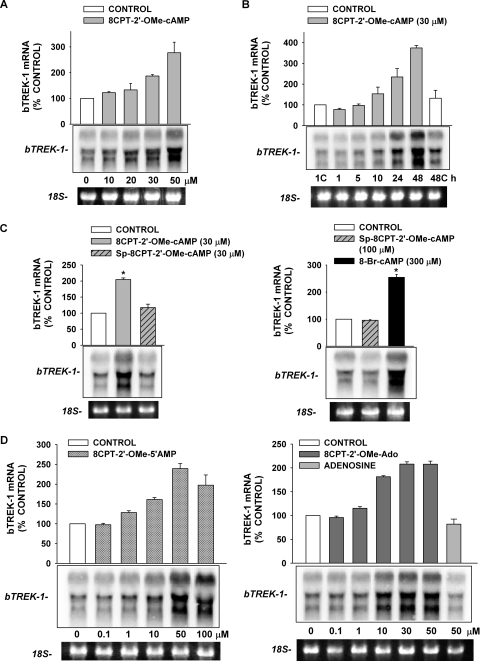
total RNA. B, time-dependent effect of 8CPT-2′-OMe-cAMP on
bTREK-1 mRNA expression. AZF cells were either untreated (control,
□) or treated with 30 μM
8CPT-2′-OMe-cAMP ()
for 1 to 48 h before isolating total RNA. C, effect of
8CPT-2′-OMe-cAMP, Sp-8CPT-2′-OMe-cAMP, and 8-Br-cAMP
on bTREK-1 mRNA expression. AZF cells were either untreated (control, open
bar) or treated with 30 μM 8CPT-2′-OMe-cAMP (gray
bar, left), 30 μM Sp-8CPT-2′-OMe-cAMP (gray striped
bar, left), 100 μM Sp-8CPT-2′-OMe-cAMP (gray striped
bar, right), or 300 μM 8-Br-cAMP (black bar, right) for 48 h
before isolating total RNA (*, P < 0.005). D,
effect of metabolites of 8CPT-2′-OMe-cAMP on induction of
bTREK-1 mRNA. AZF cells were treated with either
8CPT-2′-OMe-5′AMP (0.1–100
μM, gray dotted bars), 8CPT-2′-OMe-Ado
(0.1–50 μM, dark gray bars). or adenosine (50
μM, light gray bar) for 48 h before isolating total RNA.
) for 48 h before isolating
total RNA. B, time-dependent effect of 8CPT-2′-OMe-cAMP on
bTREK-1 mRNA expression. AZF cells were either untreated (control,
□) or treated with 30 μM
8CPT-2′-OMe-cAMP ()
for 1 to 48 h before isolating total RNA. C, effect of
8CPT-2′-OMe-cAMP, Sp-8CPT-2′-OMe-cAMP, and 8-Br-cAMP
on bTREK-1 mRNA expression. AZF cells were either untreated (control, open
bar) or treated with 30 μM 8CPT-2′-OMe-cAMP (gray
bar, left), 30 μM Sp-8CPT-2′-OMe-cAMP (gray striped
bar, left), 100 μM Sp-8CPT-2′-OMe-cAMP (gray striped
bar, right), or 300 μM 8-Br-cAMP (black bar, right) for 48 h
before isolating total RNA (*, P < 0.005). D,
effect of metabolites of 8CPT-2′-OMe-cAMP on induction of
bTREK-1 mRNA. AZF cells were treated with either
8CPT-2′-OMe-5′AMP (0.1–100
μM, gray dotted bars), 8CPT-2′-OMe-Ado
(0.1–50 μM, dark gray bars). or adenosine (50
μM, light gray bar) for 48 h before isolating total RNA.
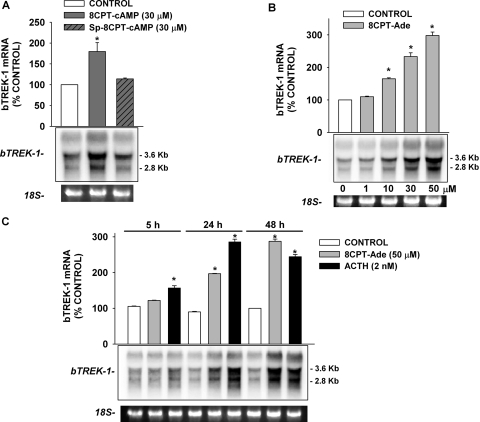 ) for 48 h before isolating
total RNA (*, P < 0.001). C, time-dependent
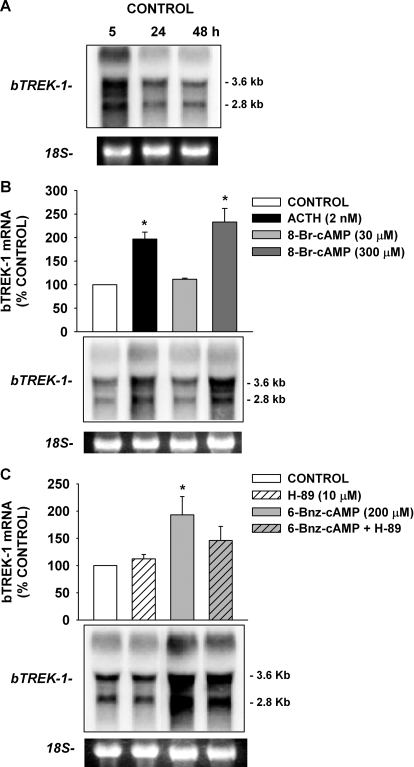
effect of 8CPT-Ade and adrenocorticotropin (ACTH) on bTREK-1 mRNA
expression. AZF cells were either untreated (control, □) or
treated with 30 μM 8CPT-cAMP () or 2 nM adrenocorticotropin (■)
for 5, 24, and 48 h before isolating total RNA (*, P
< 0.001).
) for 48 h before isolating
total RNA (*, P < 0.001). C, time-dependent
effect of 8CPT-Ade and adrenocorticotropin (ACTH) on bTREK-1 mRNA
expression. AZF cells were either untreated (control, □) or
treated with 30 μM 8CPT-cAMP () or 2 nM adrenocorticotropin (■)
for 5, 24, and 48 h before isolating total RNA (*, P
< 0.001).Similar articles
-
ACTH induces Cav3.2 current and mRNA by cAMP-dependent and cAMP-independent mechanisms.J Biol Chem. 2010 Jun 25;285(26):20040-50. doi: 10.1074/jbc.M110.104190. Epub 2010 Apr 27. J Biol Chem. 2010. PMID: 20424171 Free PMC article.
-
ACTH inhibits bTREK-1 K+ channels through multiple cAMP-dependent signaling pathways.J Gen Physiol. 2008 Aug;132(2):279-94. doi: 10.1085/jgp.200810003. J Gen Physiol. 2008. PMID: 18663135 Free PMC article.
-
N6-substituted cAMP analogs inhibit bTREK-1 K+ channels and stimulate cortisol secretion by a protein kinase A-independent mechanism.Mol Pharmacol. 2009 Dec;76(6):1290-301. doi: 10.1124/mol.109.057075. Epub 2009 Sep 4. Mol Pharmacol. 2009. PMID: 19734321 Free PMC article.
-
Biochemical and Ionic signaling mechanisms for ACTH-stimulated cortisol production.Vitam Horm. 2005;70:265-79. doi: 10.1016/S0083-6729(05)70008-X. Vitam Horm. 2005. PMID: 15727807 Review.
-
Cell physiology of cAMP sensor Epac.J Physiol. 2006 Nov 15;577(Pt 1):5-15. doi: 10.1113/jphysiol.2006.119644. Epub 2006 Sep 14. J Physiol. 2006. PMID: 16973695 Free PMC article. Review.
Cited by
-
Cyclic AMP sensor EPAC proteins and energy homeostasis.Trends Endocrinol Metab. 2014 Feb;25(2):60-71. doi: 10.1016/j.tem.2013.10.004. Epub 2013 Nov 12. Trends Endocrinol Metab. 2014. PMID: 24231725 Free PMC article. Review.
-
Enhanced leptin sensitivity, reduced adiposity, and improved glucose homeostasis in mice lacking exchange protein directly activated by cyclic AMP isoform 1.Mol Cell Biol. 2013 Mar;33(5):918-26. doi: 10.1128/MCB.01227-12. Epub 2012 Dec 21. Mol Cell Biol. 2013. PMID: 23263987 Free PMC article.
-
Variants of stretch-activated two-pore potassium channel TREK-1 associated with preterm labor in humans.Biol Reprod. 2012 Oct 25;87(4):96. doi: 10.1095/biolreprod.112.099499. Print 2012 Oct. Biol Reprod. 2012. PMID: 22811574 Free PMC article.
-
Identification of Bioactive Chemical Markers in Zhi zhu xiang Improving Anxiety in Rat by Fingerprint-Efficacy Study.Molecules. 2018 Sep 12;23(9):2329. doi: 10.3390/molecules23092329. Molecules. 2018. PMID: 30213112 Free PMC article.
-
Intracellular cAMP Sensor EPAC: Physiology, Pathophysiology, and Therapeutics Development.Physiol Rev. 2018 Apr 1;98(2):919-1053. doi: 10.1152/physrev.00025.2017. Physiol Rev. 2018. PMID: 29537337 Free PMC article. Review.
References
-
- Ahlgren R, Simpson ER, Waterman MR, Lund J. (1990) Characterization of the promoter/regulatory region of the bovine CYP11A (P-450scc) gene. Basal and cAMP-dependent expression. J Biol Chem 265:3313–3319 - PubMed
-
- Chepurny OG, Leech CA, Kelley GG, Dzhura I, Dzhura E, Li X, Rindler MJ, Schwede F, Genieser HG, Holz GG. (2009) Enhanced Rap1 activation and insulin secretagogue properties of an acetoxymethyl ester of an Epac-selective cyclic AMP analogue in rat INS-1 cells: studies with 8-pCPT-2′-O-Me-cAMP-AM. J Biol Chem 284:10728–10736 - PMC - PubMed
-
- Christensen AE, Selheim F, de Rooij J, Dremier S, Schwede F, Dao KK, Martinez A, Maenhaut C, Bos JL, Genieser HG, et al. (2003) cAMP analog mapping of Epac1 and cAMP kinase. Discriminating analogs demonstrate that Epac and cAMP kinase act synergistically to promote PC-12 cell neurite extension. J Biol Chem 278:35394–35402 - PubMed
Publication types
MeSH terms
Substances
Grants and funding
LinkOut - more resources
Full Text Sources
