. 2009 Dec;21(12):3984-4001.
doi: 10.1105/tpc.109.071548. Epub 2009 Dec 22.

Heat shock protein cognate 70-4 and an E3 ubiquitin ligase, CHIP, mediate plastid-destined precursor degradation through the ubiquitin-26S proteasome system in Arabidopsis

Affiliations

Heat shock protein cognate 70-4 and an E3 ubiquitin ligase, CHIP, mediate plastid-destined precursor degradation through the ubiquitin-26S proteasome system in Arabidopsis

Sookjin Lee et al. Plant Cell. 2009 Dec.

Abstract

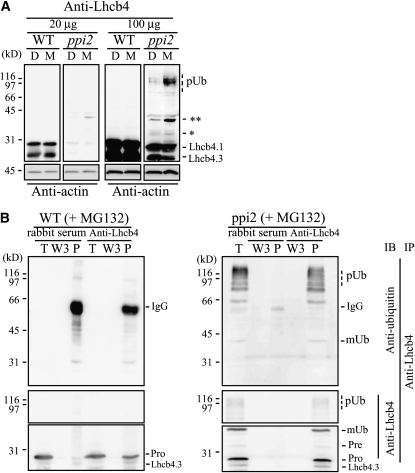
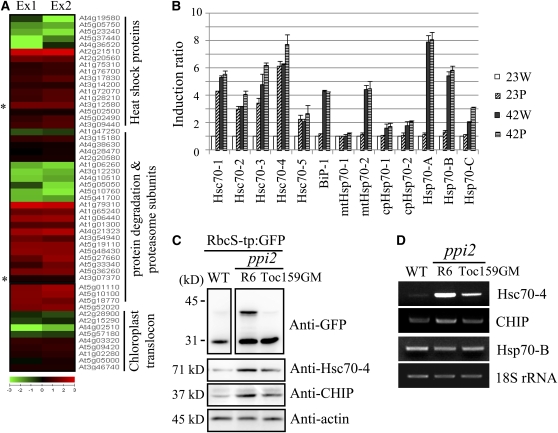
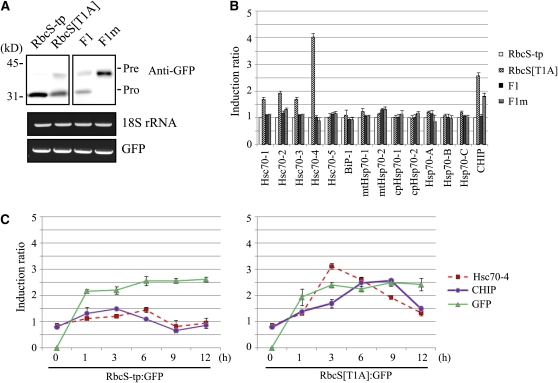
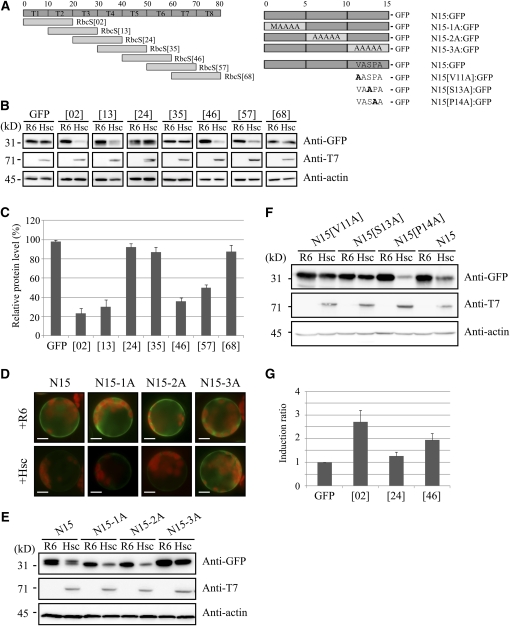
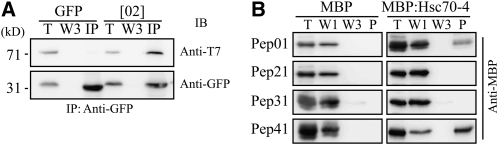
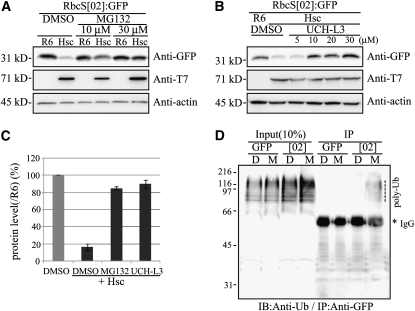
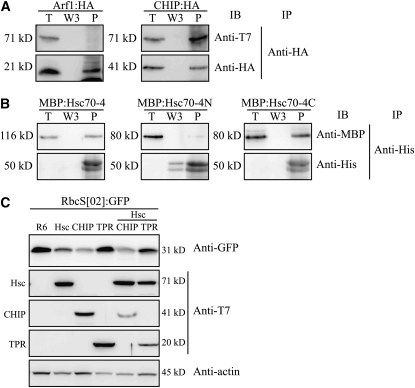
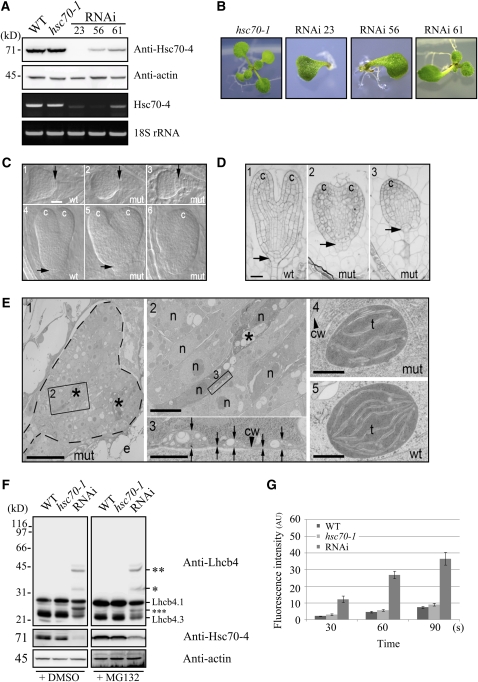
Plastid-targeted proteins pass through the cytosol as unfolded precursors. If proteins accumulate in the cytosol, they can form nonspecific aggregates that cause severe cellular damage. Here, we demonstrate that high levels of plastid precursors are degraded through the ubiquitin-proteasome system (UPS) in Arabidopsis thaliana cells. The cytosolic heat shock protein cognate 70-4 (Hsc70-4) and E3 ligase carboxy terminus of Hsc70-interacting protein (CHIP) were highly induced in plastid protein import2 plants, which had a T-DNA insertion at Toc159 and showed an albino phenotype and a severe defect in protein import into chloroplasts. Hsc70-4 and CHIP together mediated plastid precursor degradation when import-defective chloroplast-targeted reporter proteins were transiently expressed in protoplasts. Hsc70-4 recognized specific sequence motifs in transit peptides and thereby led to precursor degradation through the UPS. CHIP, which interacted with Hsc70-4, functioned as an E3 ligase in the Hsc70-4-mediated protein degradation. The physiological role of Hsc70-4 was confirmed by analyzing Hsc70-4 RNA interference plants in an hsc70-1 mutant background. Plants with lower Hsc70 levels exhibited abnormal embryogenesis, resulting in defective seedlings that displayed high levels of reactive oxygen species and monoubiquitinated Lhcb4 precursors. We propose that Hsc70-4 and CHIP mediate plastid-destined precursor degradation to prevent cytosolic precursor accumulation and thereby play a critical role in embryogenesis.


Figures

Figure 1.
Figure 1.
Lhcb4 Is Degraded by 26S Proteasome through Polyubiquitination in ppi2 Mutants. (A) Ubiquitination of endogenous Lhcb4 in ppi2 plants. Protein extracts from wild-type and ppi2 plants that had been incubated with MG132 (M) or DMSO (D) were analyzed by protein gel blotting using anti-Lhcb4 antibody. Actin was used as a loading control. Five times more ppi2 extract than wild-type extract was loaded per gel lane. pUb, polyubiquitinated forms. Asterisks (* and **) indicate expected positions of precursor and monoubiquitinated Lhcb4.1 precursors, respectively. (B) Immunoprecipitation of polyubiquitinated Lhcb4. Protein extracts from MG132-treated ppi2 mutants were subjected to immunoprecipitation using anti-Lhcb4. As a control, immunoprecipitation was performed with unrelated rabbit serum. The immunoprecipitates were analyzed by protein gel blotting using the indicated antibodies. In the anti-Lhcb4 immunoblots, the dotted lines indicate the region that was cut out to save space. IP, immunoprecipitation; IB, immunoblot. T, 10% of total extract; W3, third washing fraction; P, precipitates; IgG, IgG heavy chain; pUb, polyubiquitinated proteins; mUb, monoubiquitinated Lhcb4.
Figure 2.
Figure 2.
Cytosolic Hsc70 Isoforms, in Particular Hsc70-4 and CHIP, Were Highly Induced in ppi2 Mutant Plants. (A) Differential expression of 49 genes in ppi2 mutants as determined by hierarchical clustering of microarray data. The genes involved in the heat shock response, UPS pathways, and protein import into chloroplasts were selected and analyzed for their expression patterns. Red, green, and black, upregulated, downregulated, and no change relative to the wild type, respectively; Ex1 and Ex2, two independent experiments. (B) RT-PCR analysis of the transcript levels of 13 Arabidopsis Hsp70 homologs in ppi2 and wild-type plants. Total RNA was prepared from ppi2 and wild-type plants that had been treated with or without heat shock at 42°C for 30 min. RT-PCR was performed using gene-specific primers for 13 Hsp70 homologs (see Supplemental Table 1 online). The transcript levels of individual Hsp70 homologs in ppi2 plants were compared with those in wild-type plants. The intensity of amplified PCR products after agarose gel electrophoresis was quantified. PCR was performed at the same conditions for all 13 Hsp70 homologs. Three independent experiments were performed. 23W and 23P, wild-type and ppi2 plants at normal conditions (23°C), respectively; 42W and 42P, wild-type and ppi2 plants treated with heat shock at 42°C for 30 min, respectively. Error bar indicates se (n = 3). (C) Hsc70-4 and CHIP protein levels in ppi2 plants. Protein extracts from wild-type and ppi2 plants were analyzed by protein gel blot analysis using anti-Hsc70-4 and anti-CHIP antibodies. In addition, protein extracts from ppi2 protoplasts transformed with T7:Toc159GM were included in the analysis. Actin levels were determined as a loading control. (D) Suppression of Hsc70-4 and CHIP induction by T7:Toc159GM in ppi2 protoplasts. Total RNA from ppi2 protoplasts transformed with T7:Toc159GM, or empty expression vector (R6), was used for RT-PCR analysis at the same conditions using specific primers for Hsc70-4, Hsp70-B, CHIP, and 18S rRNA. Total RNA from wild-type plants was included in the analysis. ppi2 protoplasts were transformed with RbcS-tp:GFP together with T7:Toc159GM or R6. As a control, wild-type protoplasts were transformed with RbcS-tp:GFP.
Figure 3.
Figure 3.
Hsc70-4 and CHIP Were Induced by High Levels of Plastid Precursors. (A) Protein gel blot and agarose gel analyses of reporters at protein and transcript levels in protoplasts. Protoplasts were transformed with the indicated constructs and reporter proteins were analyzed by protein gel blots using an anti-GFP antibody (top panel). Total RNA from protoplasts transformed with the indicated constructs was subjected to RT-PCR analysis using primers specific for GFP and 18S rRNA. Amplified PCR fragments were analyzed by agarose gel electrophoresis (bottom panel). RbcS-tp, RbcS-tp:GFP; RbcS[T1A], RbcS[T1A]:GFP; F1, F1:GFP; F1m, F1m:GFP; Pre, precursor; Pro, processed forms. All TPs are fused to GFP. (B) Protoplasts were transformed with the indicated constructs. Total RNA was prepared and subjected to RT-PCR analysis using gene-specific primers for 13 Hsp70 homologs. The intensity of the amplified products after agarose gel electrophoresis was quantified and is presented relative to RbcS-tp:GFP. Three independent transformation experiments were performed. Error bar indicaets se (n = 3). RbcS-tp, wild-type RbcS-tp; RbcS[T1A], RbcS-tp with Ala substitutions of the first 10–amino acid segment; F1 and F1m, presequence of mitochondrial F1-ATPase-γ subunit and an Ala substitution mutant, respectively. All RbcS TPs and mitochondrial presequences were fused to GFP. (C) Time course of Hsc70-4 and CHIP induction in protoplasts. Protoplasts were transformed with RbcS-tp:GFP or RbcS[T1A]:GFP. Total RNA from the transformed protoplasts was prepared at the indicated time point after transformation and used for RT-PCR using specific primers for GFP, Hsc70-4, or CHIP. Three independent experiments were performed. Error bar indicates se (n = 3). [See online article for color version of this figure.]
Figure 4.
Figure 4.
Hsc70-4 Causes Degradation of Unimported Plastid Precursors. (A) to (C) Effect of Hsc70-4 on chloroplast-targeted GFP reporters. Wild-type TPs of RbcS, Cab, and RA (A), mutant TPs of RbcS-tp (B), and mutant TPs of Cab-tp (C) were used to deliver GFP into chloroplasts in protoplasts. The indicated reporter constructs were introduced into protoplasts together with T7:Hsc70-4 (Hsc, 10 μg) or R6 (empty expression vector, 10 μg), and protein levels were examined by protein gel blots using anti-GFP and anti-T7 antibodies. Pre, precursor; Pro, processed form. [T1A]+1S, [T1A]+2S and [T1A]+3S, one to three Ser residues in the RbcS[T1A] background; in Cab[T2A] to Cab[T6A], the second to sixth 10–amino acid segments were substituted with Ala residues (see Supplemental Figure 4 online). All TPs were fused to GFP. (D) Specificity of Hsc70-4–mediated protein degradation. Protoplasts were transformed with the indicated constructs, and protein levels were determined by protein gel blots using anti-GFP, anti-T7, and anti-actin antibodies. Actin was assessed as a loading control. Hsc, T7:Hsc70-4; AALP, AALP:GFP.
Figure 5.
Figure 5.
Specific Sequence Motifs of RbcS-tp Are Involved in Both Hsc70-4–Mediated Precursor Degradation and Hsc70-4 Induction. (A) Schematic representation of GFP reporter constructs. A series of overlapping 20–amino acid segments (amino acid 1 to 20 [02], 11 to 30 [13], 21 to 40 [24], 31 to 50 [35], 41 to 60 [46], 51 to 70 [57], and 61 to 80 [68]) of RbcS-tp were fused to GFP at their N terminus. The N-terminal 15–amino acid segment of RbcS-tp was divided into three 5–amino acid blocks, and each block was substituted with Ala residues, with the exception of the initiating Met in the first 5–amino acid block. In the third 5–amino acid segment, V, S, and P at positions 11, 13, and 14 were replaced with Ala to generate N15[V11A], N15[S13A], and N15[P14A], respectively. (B) and (C) Identification of the RbcS-tp domain involved in Hsc70-4–mediated degradation. Protoplasts were transformed with the indicated constructs, and proteins were analyzed by protein gel blotting using anti-GFP, anti-T7, and anti-actin antibodies. Actin was analyzed as a loading control (B). Band intensity was quantified using a software-equipped LAS3000 system (Fujifilm). The data show the percentage of intensity of T7:Hsc70-4 relative to R6. Error bar indicates se (n = 3) (C). (D) to (F) Fine mapping of the sequence motif involved in Hsc70-4–mediated protein degradation. The indicated constructs were introduced into protoplasts together with T7:Hsc70-4 or R6, and protein levels were analyzed by monitoring the GFP signal intensity with a fluorescence microscope (D) or protein gel blotting using anti-GFP and anti-T7 antibodies ([E] and [F]). Actin was analyzed as a loading control ([E] and [F]). All TPs were fused to GFP. Red and green signals in (D), autofluorescence of chlorophyll and GFP, respectively; R6, empty expression vector; Hsc, T7:Hsc70-4. Bars in (D) = 20 μm. (G) Identification of the sequence motif for induction of Hsc70-4. Total RNA from protoplasts that had been transformed with the indicated constructs was used for RT-PCR analysis. The intensity of bands was quantified. Error bar indicates se (n = 3). [02], RbcS[02]; [24], RbcS[24]; [46], RbcS[46]. All these transit peptides are fused to GFP. GFP, GFP alone.
Figure 6.
Figure 6.
T7:Hsc70-4 Directly Interacts with the Sequence Motif Involved in Hsc70-4–Mediated Protein Degradation. Interaction between RbcS-tp and Hsc70-4. T7:Hsc70-4 was transformed into protoplasts together with GFP or RbcS[02]:GFP ([02]), and protein extracts were subjected to immunoprecipitation using an anti-GFP antibody. Immunoprecipitates were analyzed by protein gel blots using anti-T7 and anti-GFP antibodies (A). For protein pull-down experiments, oligopeptides representing regions of RbcS-tp were cross-linked to an affi-gel and then incubated with recombinant purified MBP:Hsc70-4 or MBP alone. Proteins were precipitated and analyzed by protein gel blots using an anti-MBP antibody (B). T, 10% of total extract or recombinant protein; IB, immunoblot; IP, immunoprecipitation; P, precipitate; W1 and W3, first and third washing fractions, respectively.
Figure 7.
Figure 7.
Hsc70-4 Engages the Ubiquitin/26S Proteasome Pathway for Protein Degradation. (A) to (C) Inhibition of reporter protein degradation. The indicated constructs were transformed into protoplasts, which were then treated with MG132 (A) or UCH-L3 (B). DMSO was included as a vehicle control. Protein levels were determined by protein gel blot analysis using the indicated antibodies. Actin was analyzed as a loading control. The intensity of the protein bands was quantified, and data are percentage of intensity relative to R6 + DMSO. D, DMSO; M30, MG132 (30 μM); U30, UCH-L3 (30 μM); Hsc, T7:Hsc70-4. Error bar indicates se (n = 3) (C). (D) Ubiquitination of RbcS[02]:GFP. Protein extracts from protoplasts transformed with the indicated constructs were subjected to immunoprecipitation using an anti-GFP antibody. Immunoprecipitates and total extract (10%) were analyzed by protein gel blots using an anti-ubiquitin antibody. [02], RbcS[02]:GFP; D, DMSO; M, MG132; IB, immunoblotting; IP, immnoprecipitates; Anti-Ub, anti-ubiquitin antibody; dashed line, polyubiquitinated RbcS[02]:GFP; asterisk, IgG heavy chain.
Figure 8.
Figure 8.
CHIP Interacts with Hsc70-4 and Plays a Critical Role in Hsc70-4–Induced Protein Degradation. (A) Interaction between Hsc70-4 and CHIP. Protoplasts were transformed with the indicated constructs and protein extracts were used for immunoprecipitation using an anti-HA antibody. Precipitates were analyzed by immunoblotting using anti-HA and anti-T7. Arf1:HA was used as a negative control. T, 10% of total protein extracts; W3, third wash supernatant; P, precipitates; IP, immunoprecipitation; IB, immunoblotting. (B) Protein pull-down experiment. Purified recombinant MBP:Hsc70-4, MBP:Hsc70-4N, or MBP:Hsc70-4C were incubated with His:CHIP bound to Ni+-NTA agarose. Precipitates were analyzed by protein gel blotting using anti-MBP and anti-His antibodies. T, 10% of total protein extracts; W3, the third wash supernatant; P, precipitates. (C) Inhibition of Hsc70-4–mediated degradation by the TPR domain. Protein extracts from protoplasts transformed with the indicated constructs were analyzed by protein gel blotting using anti-GFP and anti-T7. R6, empty vector; CHIP, T7:CHIP; TPR, T7:TPR domain construct.
Figure 9.
Figure 9.
RNAi(Hsc70-4)hsc70-1 Transgenic Plants Display Developmental Defects and High Levels of ROS. (A) Protein gel blot and RT-PCR analyses of RNAi plants. Protein extracts from cotyledons of hsc70-1 and RNAi plants (1 week old) were analyzed by protein gel blots using anti-Hsc70-4 and anti-actin antibodies (top two panels). In addition, total RNA from RNAi, wild-type, and hsc70-1 plants was used for RT-PCR analysis using Hsc70-4 and 18S rRNA-specific primers (bottom two panels). The images of PCR products are representative of three independent experiments. Numbers indicate independent transgenic lines. RNAi, RNAi plants. (B) Phenotype of RNAi plants. Plants were grown on MS plates for 3 weeks. (C) to (E) Light and electron microscopy analysis of RNAi embryos. (C1) to (C6) Whole-mount preparations after clearing (embryo stages: 1 to 3, late-globular/heart; 4 to 6, torpedo). Differential interference contrast optics. mut, RNAi plant (line 56); c, cotyledon; arrow, root pole. (D1) to (D3) show semithin and (E1) to (E5) ultrathin resin sections of heart-stage embryos observed by light microscopy (D) or transmission electron microscopy (E). Note single cotyledon (c) in D3. (E1) Overview of embryo (outlined); (E2) and (E3) higher magnifications of boxed areas in (E1) and (E2), respectively; (E4) and (E5) proplastids. Asterisks in (E1) and (E2), degenerating cells. Note extracellular membrane vesicles between neighboring plasma membranes ([E3]; arrows). CW (arrowhead in [E3]), cell wall; c, cotyledon; e, endosperm; n, nucleus; t, thylakoid. Bars = 20 μm in (C1) and (D), 25 μm in (E1), 5 μm in (E2), 1 μm in (E3), and 0.5 μm in (E4) and (E5). Bar in (C1) also applies to (C2) to (C6). (F) Lhcb4 levels. Protein extracts from cotyledons (1 week old) of hsc70-1, RNAi, and wild-type plants were analyzed by protein gel blots using the indicated antibodies. Actin was analyzed as a loading control. * and **, expected sizes of precursors and monoubiquitinated Lhcb4.1; ***, expected size of the Lhcb4.3 precursor. (G) Levels of ROS. Cotyledons (1 week old) were stained with DCF for the indicated periods of time, and fluorescence intensity was measured by confocal laser scanning fluorescence microscopy (see Supplemental Figure 13 online). Fluorescence intensity was quantified. AU, arbitrary unit; error bars indicate se (n = 3).

Similar articles

Cited by

References

    1. Agne, B., and Kessler, F. (2009). Protein transport in organelles: The Toc complex way of preprotein import. FEBS J. 276 1156–1165. - PubMed
    1. Alonso, J.M., et al. (2003). Genome-wide insertional mutagenesis of Arabidopsis thaliana. Science 301 653–657. - PubMed
    1. Apel, K., and Hirt, H. (2004). Reactive oxygen species: Metabolism, oxidative stress, and signal transduction. Annu. Rev. Plant Biol. 55 373–399. - PubMed
    1. Baldwin, D., Crane, V., and Rice, D. (1999). A comparison of gel-based, nylon filter and microarray techniques to detect differential RNA expression in plants. Curr. Opin. Plant Biol. 2 96–103. - PubMed
    1. Ballinger, C.A., Connell, P., Wu, Y., Hu, Z., Thompson, L.J., Yin, L.Y., and Patterson, C. (1999). Identification of CHIP, a novel tetratricopeptide repeat-containing protein that interacts with heat shock proteins and negatively regulates chaperone functions. Mol Cell Biol. 19 4535–4545. - PMC - PubMed

Publication types

MeSH terms