. 2009 Dec;21(12):4044-58.
doi: 10.1105/tpc.109.069211. Epub 2009 Dec 22.

Quantitative proteomics of the tonoplast reveals a role for glycolytic enzymes in salt tolerance

Affiliations

Quantitative proteomics of the tonoplast reveals a role for glycolytic enzymes in salt tolerance

Bronwyn J Barkla et al. Plant Cell. 2009 Dec.

Abstract

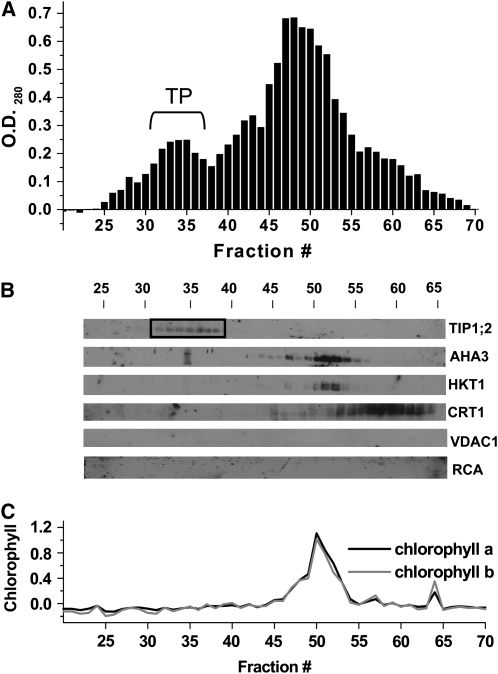
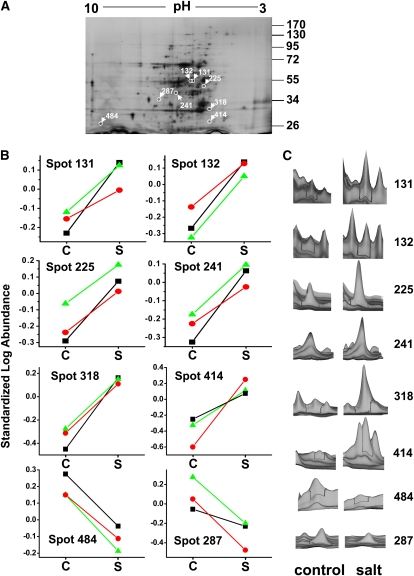
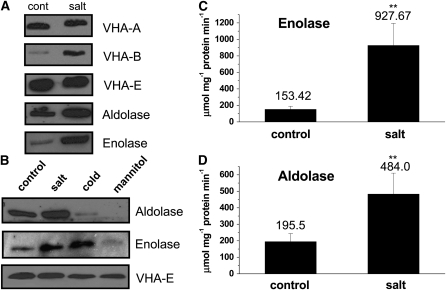
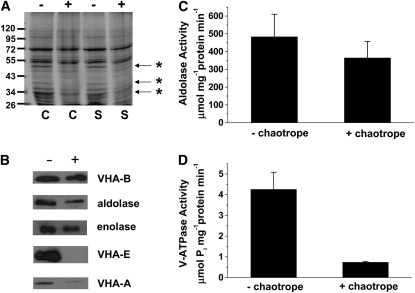
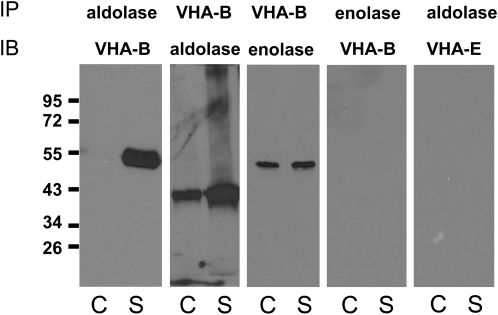
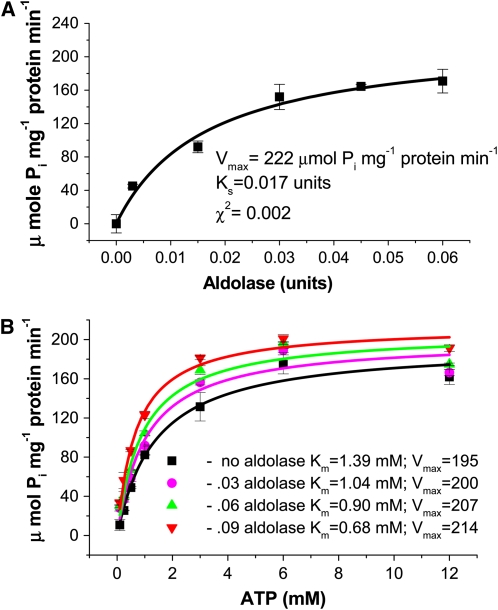
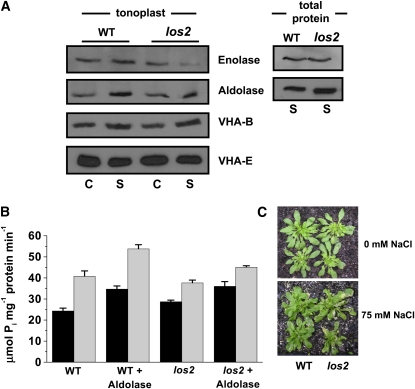
To examine the role of the tonoplast in plant salt tolerance and identify proteins involved in the regulation of transporters for vacuolar Na(+) sequestration, we exploited a targeted quantitative proteomics approach. Two-dimensional differential in-gel electrophoresis analysis of free flow zonal electrophoresis separated tonoplast fractions from control, and salt-treated Mesembryanthemum crystallinum plants revealed the membrane association of glycolytic enzymes aldolase and enolase, along with subunits of the vacuolar H(+)-ATPase V-ATPase. Protein blot analysis confirmed coordinated salt regulation of these proteins, and chaotrope treatment indicated a strong tonoplast association. Reciprocal coimmunoprecipitation studies revealed that the glycolytic enzymes interacted with the V-ATPase subunit B VHA-B, and aldolase was shown to stimulate V-ATPase activity in vitro by increasing the affinity for ATP. To investigate a physiological role for this association, the Arabidopsis thaliana cytoplasmic enolase mutant, los2, was characterized. These plants were salt sensitive, and there was a specific reduction in enolase abundance in the tonoplast from salt-treated plants. Moreover, tonoplast isolated from mutant plants showed an impaired ability for aldolase stimulation of V-ATPase hydrolytic activity. The association of glycolytic proteins with the tonoplast may not only channel ATP to the V-ATPase, but also directly upregulate H(+)-pump activity.


Figures

Figure 1.
Figure 1.
Purification of M. crystallinum Tonoplast by FFZE. M. crystallinum microsomal membranes were separated by FFZE in the presence of 3 mM ATP. (A) Protein profile of FFZE fractions showing a positive OD280. The bracket indicates the location of the ATP-dependent peak of tonoplast (TP). (B) Immunological detection in the respective fractions of (from top to bottom) the tonoplast marker TIP1;2 (26 kD), the plasma membrane marker AHA3 (100 kD), the plasma membrane marker HKT1 (56 kD), the endoplasmic reticulum marker CRT1 (57 kD), the mitochondrial marker VDAC1 (29 kD), and the chloroplast marker RCA (43 and 41 kD). The fractions corresponding to pure tonoplast are enclosed in the box. (C) Measurement of chlorophyll a and b in FFZE fractions.
Figure 2.
Figure 2.
2D-DIGE of FFZE Separated Tonoplast from M. crystallinum. (A) A representative preparative silver-stained gel of tonoplast fractions from salt-treated plants. Protein (200 μg) was separated by isoelectric focusing on 3 to 10 linear immobilized pH gradient strips for the first dimension and by SDS-PAGE on a 10% linear acrylamide gel for the second dimension. Eight protein spots that showed significant changes in abundance between the control and salt-treated tonoplast samples after analysis with Decyder Software (>1.5-fold change, P ≤ 0.05; Student's t test [P ≤ 0.03]; n = 3) are circled and labeled with the software-derived spot number. The positions of PAGE molecular mass markers are shown in kilodaltons on the right of the gel image. (B) Graphical representation of the standardized log abundance (i.e., log abundance of Cy3- or Cy5-labeled spot over log abundance of Cy2-labeled standard spot). Individual lines show each of the three biological replicates from control (C) and salt (S)-treated tonoplast. Triangles, values from gel 1; circles, values from gel 2; squares, values from gel 3. (C) The three-dimensional fluorescence intensity profiles of the individual spots shown for one of the biological replicates comparing control and salt-treated profiles of each of the eight protein spots that showed significant changes. [See online article for color version of this figure.]
Figure 3.
Figure 3.
Aldolase and Enolase Are Salt-Regulated Proteins Detected in Tonoplast Fractions of M. crystallinum. (A) Protein blots of isolated tonoplast from plants treated for 1 week in the absence (cont) or presence (salt) of 200 mM NaCl. SDS-PAGE separated tonoplast protein was probed with polyclonal antibodies individually raised against VHA-A, VHA-B, and VHA-E subunits of the V-ATPase, or the glycolytic enzymes aldolase and enolase, which recognized proteins of 72, 55, 29, 38, and 50 kD polypeptides, respectively. Blots are representative of three independent experiments. (B) Protein blots of isolated tonoplast from plants treated for 1 week in the absence (control) or presence of 200 mM NaCl (salt) or at 4°C (cold) in the presence of 400 mM mannitol. Blots are representative of three independent experiments. (C) Aldolase and enolase enzymatic activity in tonoplast isolated from control and salt-treated plants. Results are presented as mean ± se (n = 3). Statistical significance was evaluated using Student's t test for pairwise comparison and analysis of variance for comparison of data from several groups. A probability level of <0.01 (indicated by asterisks) was considered highly significant.
Figure 4.
Figure 4.
Protein Blot Analysis and Effect of Chaotrope Treatment on Enzyme Activities in Tonoplast of M. crystallinum. (A) Coomassie blue–stained gel of tonoplast isolated from control (C) and salt (S)-treated plants (200 mM NaCl for 1 week) incubated in the presence (+) or absence (−) of 200 mM Na2CO3, pH 11.4, and 3 mM MgATP. Proteins that are clearly absent in the chaotrope treated lanes are marked (asterisks). (B) Protein blot analysis of tonoplast from salt-treated plants incubated in the presence (+) or absence (−) of 200 mM Na2CO3, pH 11.4, and 3 mM MgATP and probed with antibodies against V-ATPase subunits VHA-B, VHA-E, and VHA-A and the enzymes aldolase and enolase. (C) Aldolase activity in tonoplast from salt-treated plants incubated in the presence (+ chaotrope) or absence (− chaotrope) of 200 mM Na2CO3, pH 11.4, and 3 mM MgATP. Values are means ± se from three experiments. (D) V-ATPase hydrolytic activity in tonoplast from salt-treated plants incubated in the presence (+ chaotrope) or absence (− chaotrope) of 200 mM Na2CO3, pH 11.4, and 3 mM MgATP. Values are means ± se from three experiments.
Figure 5.
Figure 5.
Aldolase Interacts with the VHA-B Subunit of the V-ATPase. Leaf tonoplast protein (15 μg) from control (C) and salt-treated (S) M. crystallinum plants was analyzed by reciprocal immunoprecipitation (IP), SDS-PAGE, and immunoblotting (IB) as described in Methods, using the indicated antibodies (top antibody was used for immunoprecipitation; bottom antibody was used to probe blots). The results shown are representative of experiments that were repeated three times, which yielded identical results. The positions of PAGE molecular mass markers are shown in kilodaltons on the left of the panels.
Figure 6.
Figure 6.
Aldolase Stimulates V-ATPase Hydrolytic Activity by Increasing Affinity for ATP. (A) V-ATPase hydrolytic activity (bafilomycin-sensitive and azide- and vanadate-insensitive) was estimated by spectrophotometric measurement of inorganic phosphate release as described in Methods. Activity was measured in tonoplast vesicles (15 μg protein) isolated from M. crystallinum over a range of aldolase concentrations. Data represent means ± se of three replicate experiments. Each replicate experiment was performed using independent membrane preparations. The solid lines show the fit of the kinetic data with the Michaelis-Menten equation, and from this the rate constants Ks and Vmax were calculated. Ks refers to the concentration of aldolase that gives half the maximal velocity, and Vmax refers to the velocity of the enzyme catalyzed reaction at saturating aldolase concentrations. The χ2 value indicates the goodness of fit and confirmed that the data fitted the equation at a probability level of at least P < 0.01. (B) V-ATPase hydrolytic activity was measured over a range of ATP concentrations in the presence of increasing amounts of aldolase. Data represent means ± se of three replicate experiments performed using independent membrane preparations. The solid lines show the fit of the data with the Michaelis-Menten equation. Units for Vmax are μmol Pi mg−1 protein min−1. The χ2 values, indicating the goodness of fit of the data to the equation, gave probabilities of at least P < 0.05. [See online article for color version of this figure.]
Figure 7.
Figure 7.
The los2 Arabidopsis Enolase Mutant Shows a Salinity-Dependent Reduction in Enolase Abundance at the Tonoplast and a Salinity-Dependent Reduction in Aldolase Stimulation of V-ATPase Hydrolytic Activity and Is Salt Sensitive. (A) Immunodetection of enolase, aldolase, and VHA subunits in tonoplast (left) and enolase and aldolase in total protein fractions (right), isolated from wild-type (Col-0) and los2 Arabidopsis plants grown in the absence (C) or presence (S) of 75 mM NaCl for 4 d as indicated. Blots are representative of three independent experiments. (B) V-ATPase hydrolytic activity in the presence or absence of 0.03 units of aldolase was estimated by spectrophotometric measurement of inorganic phosphate release as described in Methods. Activity was measured in tonoplast vesicles (15 ug protein) isolated from wild-type (Col-0) or los2 plants grown in the absence (black bars) or presence (thatched bars) of 75 mM NaCl for 4 d. Data represent means ± se of three replicate experiments. (C) Response of wild-type (Col-0) and los2 plants to salinity. Plants were grown in the absence (top) or presence (bottom) of 75 mM NaCl for 4 d. Visual phenotype of leaves is shown with noticeable wilting and chlorotic lesions on the mutant plant.

Similar articles

Cited by

References

    1. Alban, A., David, S.O., Bjorkesten, L., and Andersson, C. (2003). A novel experimental design for comparative two-dimensional gel analysis: Two-dimensional difference gel electrophoresis incorporating a pooled internal standard. Proteomics 3 36–44. - PubMed
    1. Ames, B.N. (1966). Assay of inorganic phosphate, total phosphate and phosphatases. Methods Enzymol. 8 115–118.
    1. Apse, M.P., Sottosanto, J.B., and Blumwald, E. (2003). Vacuolar cation/H+ exchange, ion homeostasis, and leaf development are altered in a T-DNA insertional mutant of AtNHX1, the Arabidopsis vacuolar Na+/H+ antiporter. Plant J. 36 229–239. - PubMed
    1. Arnon, D.I. (1949). Copper enzymes in isolated chloroplasts: polyphenol oxidase in Beta vulgaris. Plant Physiol. 24 1–15. - PMC - PubMed
    1. Barkla, B.J., Vera-Estrella, R., and Pantoja, O. (2007). Enhanced separation of membranes during free flow zonal electrophoresis in plants. Anal. Chem. 79 5181–5187. - PubMed

Publication types

MeSH terms