Comparative Study
. 2009:74:235-48.
doi: 10.1101/sqb.2009.74.037. Epub 2009 Dec 22.

Drosophila brain development: closing the gap between a macroarchitectural and microarchitectural approach

Affiliations
Comparative Study

Drosophila brain development: closing the gap between a macroarchitectural and microarchitectural approach

A Cardona et al. Cold Spring Harb Symp Quant Biol. 2009.

Abstract

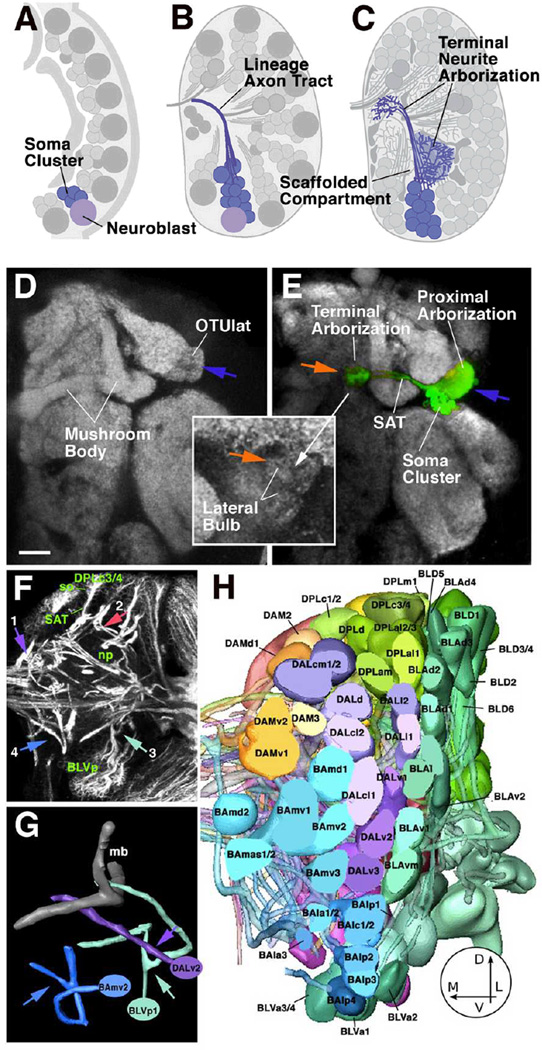
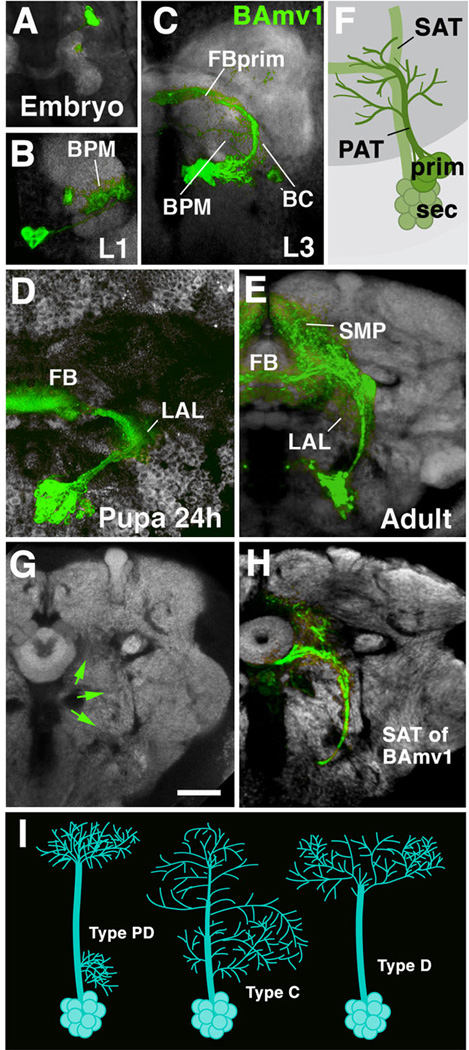
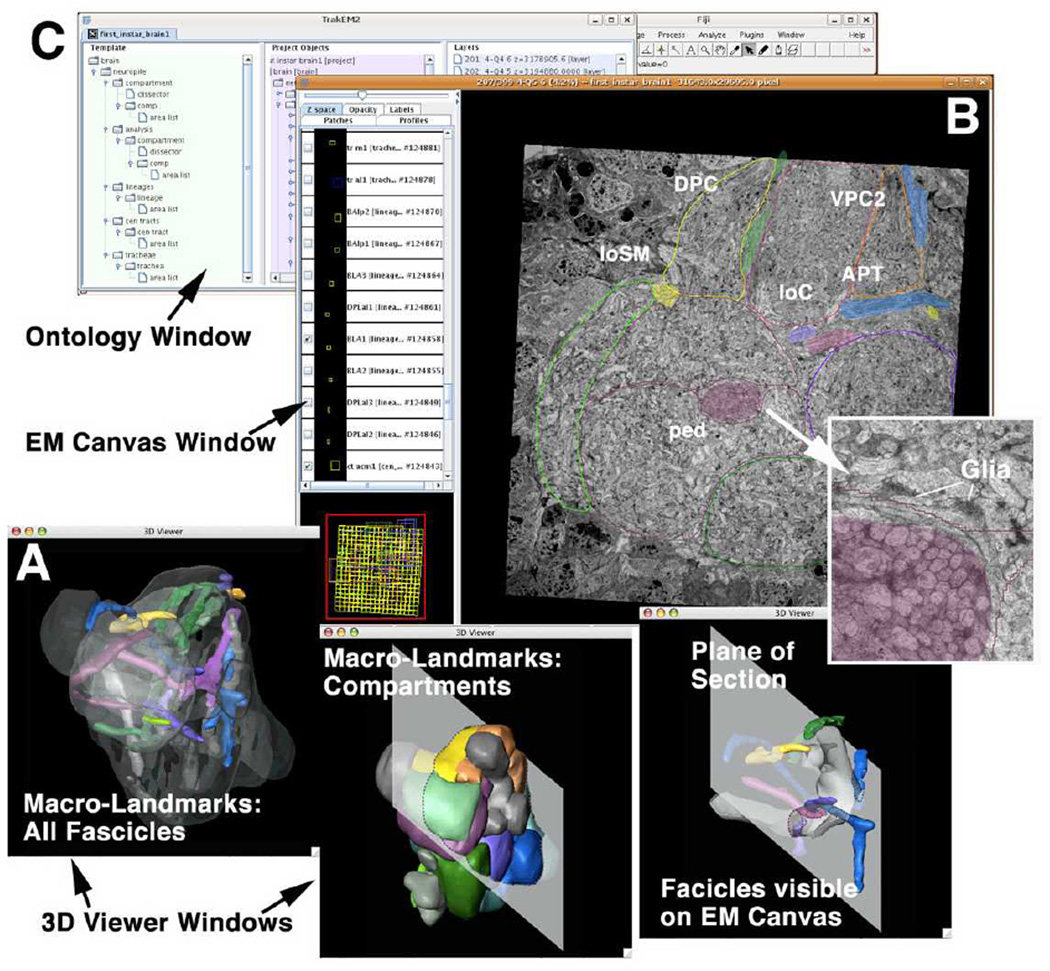
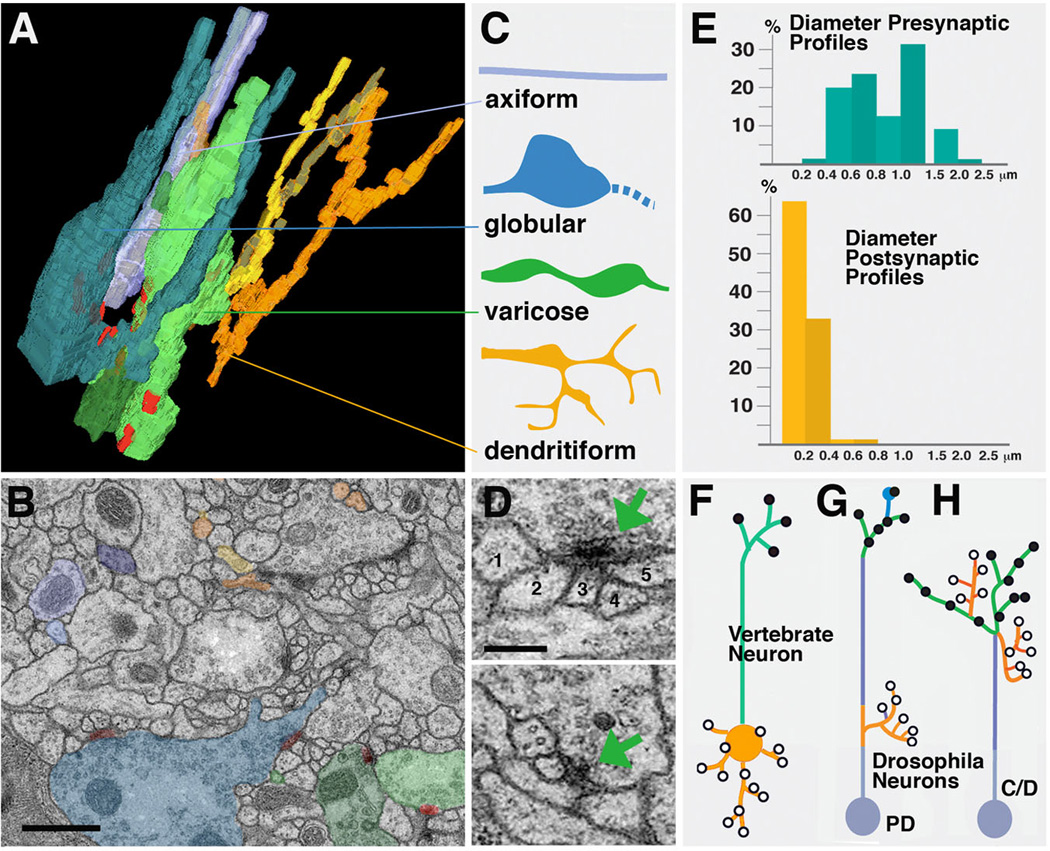
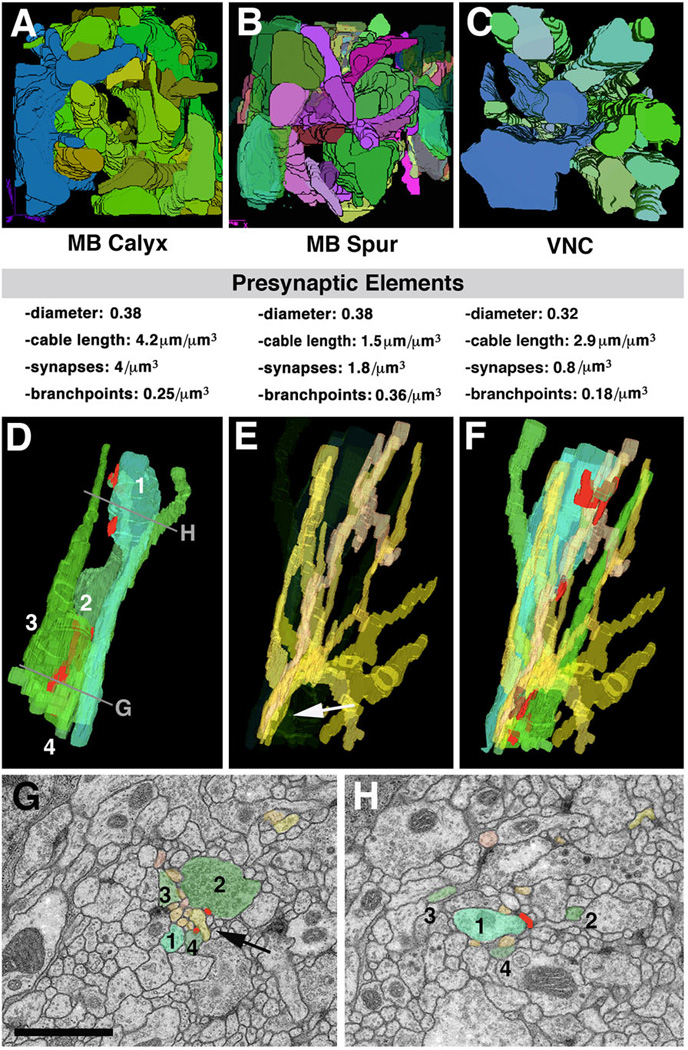
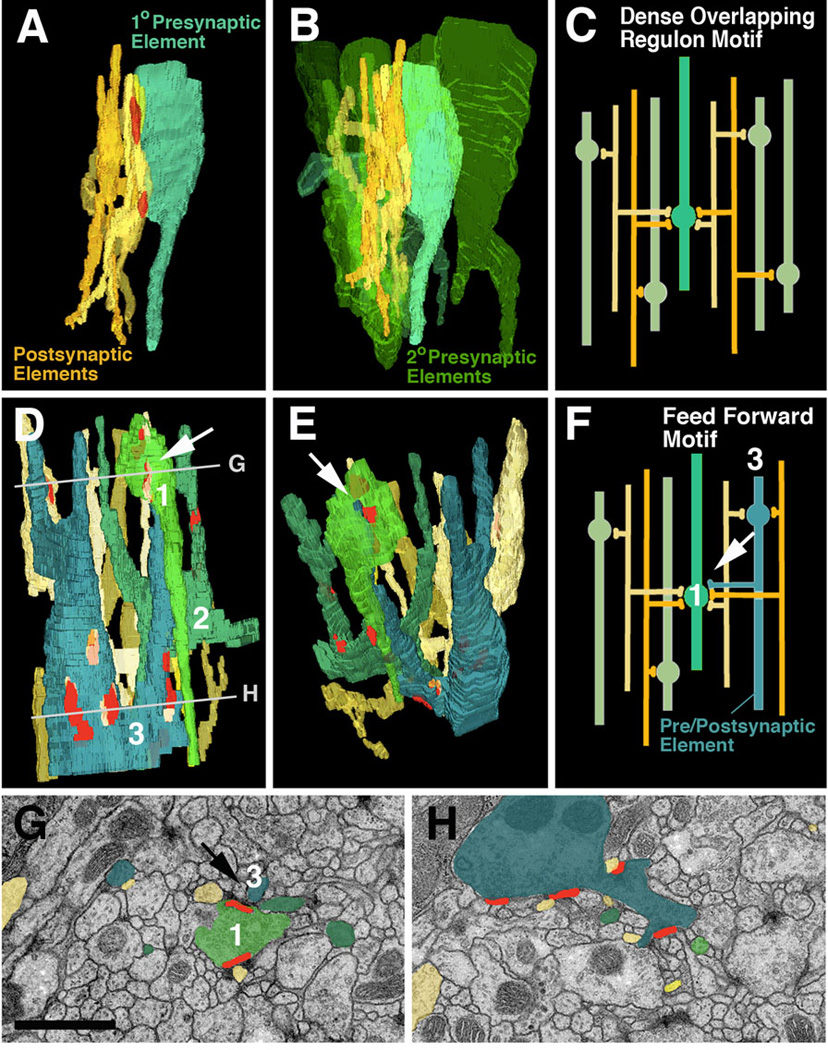
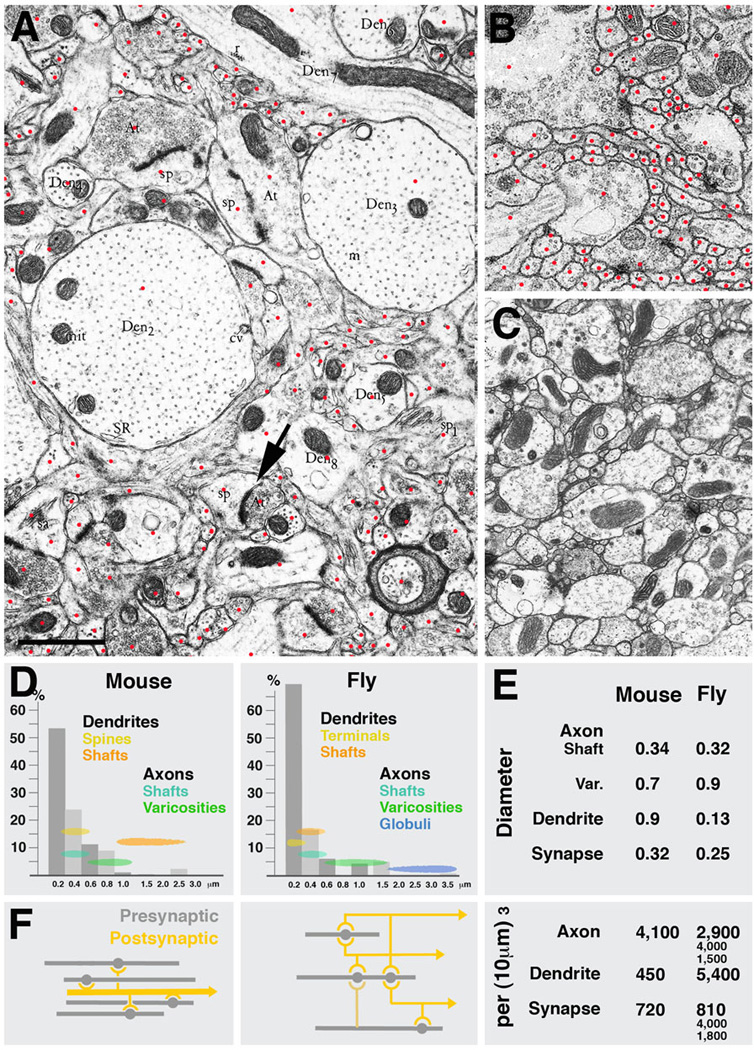
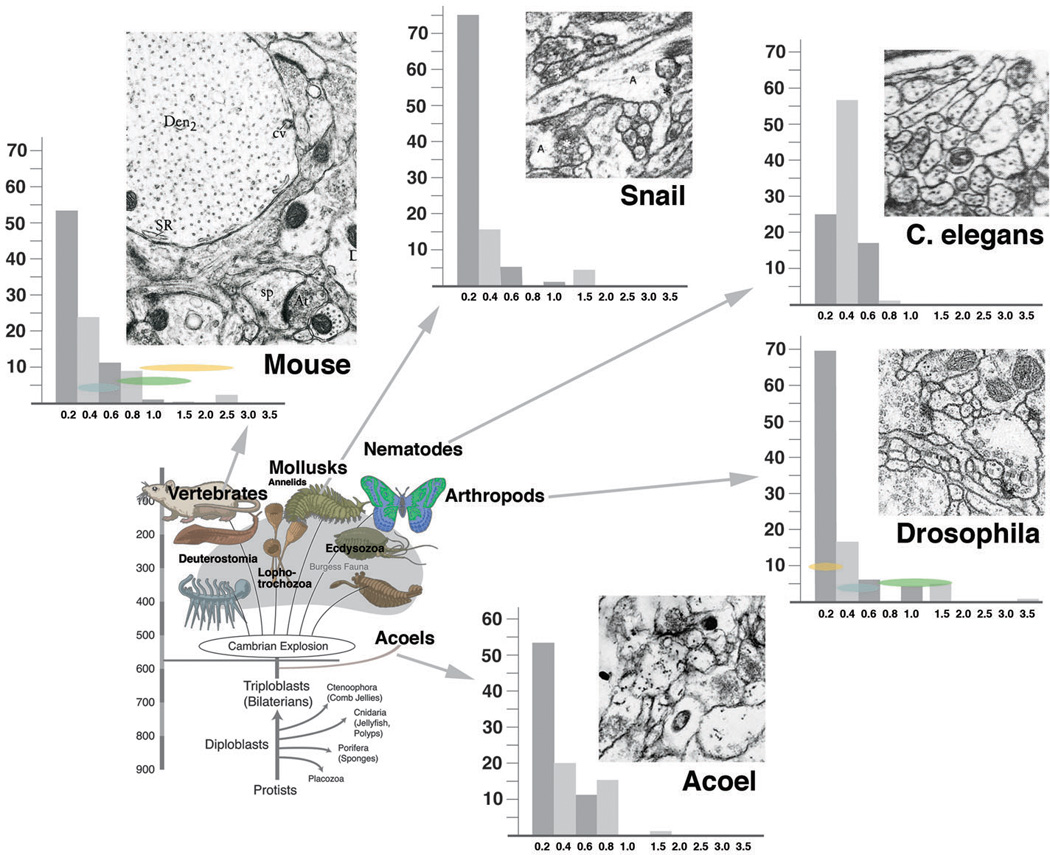
Neurobiologists address neural structure, development, and function at the level of "macrocircuits" (how different brain compartments are interconnected; what overall pattern of activity they produce) and at the level of "microcircuits" (how connectivity and physiology of individual neurons and their processes within a compartment determine the functional output of this compartment). Work in our lab aims at reconstructing the developing Drosophila brain at both levels. Macrocircuits can be approached conveniently by reconstructing the pattern of brain lineages, which form groups of neurons whose projections form cohesive fascicles interconnecting the compartments of the larval and adult brain. The reconstruction of microcircuits requires serial section electron microscopy, due to the small size of terminal neuronal processes and their synaptic contacts. Because of the amount of labor that traditionally comes with this approach, very little is known about microcircuitry in brains across the animal kingdom. Many of the problems of serial electron microscopy reconstruction are now solvable with digital image recording and specialized software for both image acquisition and postprocessing. In this chapter, we introduce our efforts to reconstruct the small Drosophila larval brain and discuss our results in light of the published data on neuropile ultrastructure in other animal taxa.


Figures

Fig. 1
Fig. 1
Developmental and structural characteristics of wild-type lineages. A-C: Lineages as units of gene expression, projection, and connectivity. Stereotyped population of neuroblasts generates neurons in the embryo and larva (A). Neurons belonging to one lineage form a cohesive cluster and project their axons in one fascicle (B). Terminal branches of neurons of one lineage arborize in specific neuropile compartments (C). D, E: Z-projection of adult brain hemisphere labeled with anti-Bruchpilot (Nc82; Kittel et al., 2006) to visualize neuropile compartments (white). In E, one lineage, DALcl1, is labeled by expression of GFP. Note dense proximal arborization restricted to lateral domain of optic tubercle (OTUlat; one of the optic foci); distal arborization is restricted to the lateral bulb, one of the input regions of the central complex. F: Z-projection of 10 successive 1µm confocal cross sections at level of central neuropile. Secondary lineages, their axon tracts (secondary axon tracts; SATs) and neuropile fascicles formed by convergence of SATs are labeled with anti-Neurotactin antibody (white). Clusters of somata (so) belonging to lineages are located in the cortex; axon tracts project centripetally into the neuropile (np). Arrows point at lineages representing the types of SAT trajectories observed: SAT is unbranched and enters the neuropile in a straight course (1; DPMm lineage) or after a sharp turn at the cortex-neuropile boundary (2; DPLc3/4). (3) SAT bifurcates into two branches at cortex-neuropile boundary (BLVp1/2); (4) distal part of SAT bifurcates in neuropile (BAmv2). G: Digital models of three representative lineage tracts illustrating typical branching behavior of SATs [DALv2: straight unbranched entry into neuropile; BLVp1: bifurcation at point of entry into neuropile (arrowhead); BAmv2: bifurcation in distal leg of SAT]. H: 3D digital models of all clusters of neuronal somata representing all lineages of one brain hemisphere; anterior view. The polar region of the cortex was removed for clearer view of lineages. (panels F-H modified from from Fung et al., 2009). Bar: 20µm
Fig. 2
Fig. 2
Morphogenesis of a brain lineage from embryo to adult. A-E: Z-projections of confocal sections of one brain hemisphere in which BAmv1 lineage is labeled by GFP driven by the line per-Gal4 (Kaneko and Hall, 2000). BAmv1 has a conspicuous crescent-shaped tract, projecting first posteriorly, then dorsolaterally, and finally dorso-medially towards the primordium of the fan-shaped body (FBprim), which forms part of the CPM compartment of the larval brain. Arborizations of primary neurons occur in BC, BPM and FBprim compartments (B, C). Secondary axons follow the same trajectory and branch in the lateral accessory lbe (LAL), fan-shaped body (FB), and superior medial protocerebrum (SMP; D, E). F: Cartoon illustrating that secondary axon tract (SAT) typically fasciculates with, or at least grows close to, primary axon tract (PAT) of the corresponding lineage. G, H: Secondary axon tracts develop into long fiber bundles of adult brain. G shows frontal confocal section of adult brain hemisphere labeled with anti-Bruchpilot (Nc82; neuropile; white). In H, the secondary neurons of the BAmv1 lineage are labeled by GFP (driven by per-Gal4). Note that the coherent secondary axon tract of BAmv1 now forms a long fiber bundle which is visible as a Nc82-negative (i.e., synapse-free) “tunnel”, indicated by green arrows in G.[SF1] I: schematic representation of different types of lineages encountered in Drosophila brain (PD: separate proximal and distal arborization; C: continuous arborization; D: distal arborization). Bar: 20µm (all photographic panels at same scale)
Fig. 3
Fig. 3
The graphical user interface of TrakEM2. The EM canvas presents the EM stack. The user can scroll and navigate through all sections in the “Google Map” style. Identified structures (e.g., compartments and lineage tracts) can be segmented. The ontology window displays all segmented objects as a hierarchically organized list. The interactive 3D viewer windows show selected objects segmented from the EM stack.
Fig. 4
Fig. 4
Drosophila neuropile ultrastructure. A-C: Types of neurite profiles. A shows 3D digital model of several short neurites segmented from one micro-volume. B: representative EM section of microvolume in which profiles of neurites modeled in A are shaded in the corresponding colors. C: Schematic depiction of types of neurites. Axiform neurites (light blue) are straight, unbranched processes of intermediate (0.2–0.4µm) diameter. Globular neurites and varicose neurites (dark blue and green) have alternating segments of intermediate (0.2–0.4µm) and large diameter (0.5–1.5µm for varicose; 1–3µm for globular neurites). Dendritiform neurites (yellow, brown, orange) are highly branched and thin (< 0.2µm). D: Section of two typical polyadic synapses. Green arrow points at presynaptic specialization, consisting of the T-bar and synaptic vesicles. Presynapses are contacted by multiple, thin branches of dendritiform processes. Numbers 1–5 in upper panel denote profiles of thin, postsynaptic profiles (dendritiform neurites). #2–5 have clear, direct contact to presynaptic zone; #1 is located right adjacent to the presynaptic site, and represents a case that may or may not represent a postsynaptic neurite of this synapse. E: Correlation between frequency of presynaptic and postsynaptic sites and neurite diameter. Presynaptic sites (blue; top) are predominantly found on large diameter profiles, which correspond to thick segments of varicose and globular neurites. These neurites represent terminal axonal branches. Postsynaptic profiles (yellow, bottom) almost exclusively belong to thin dendritiform neurites; they represent terminal dendritic branches. F-H: Distribution of axonal and dendritic branches. F: Polarized vertebrate neuron with dendrite/soma compartment carrying postsynaptic sites, and axon compartment with presynaptic sites. G: Drosophila type PD neuron which comes close to the vertebrate pattern, with postsynaptic dendritiform processes concentrated proximally and presynaptic varicose/globular processes distally. H: In Drosophila type C and D neurons, terminal axons and dendrites are intermingled. Bars: 0.5µm (B); 0.2µm (D)
Fig. 5
Fig. 5
Structural network properties in Drosophila brain neuropile. Panels of the top row (A-C) show 3D digital models of presynaptic varicose/globular neurites from three different micro-volumes. A, B: micro-volumes from calyx (A; input region) and spur (B; output region) of mushroom body. In both micro-volumes, branches of terminal axonal neurites follow all directions. C: micro-volume from dorso-lateral neuropile of ventral nerve cord. All neurites are oriented predominantly along longitudinal axis. Shown below each panel are some core parameters of neurite profiles seen in micro-volumes. Note that average diameter of presynaptic elements (varicose and globular neurites) are very similar between the different regions. Density of presynaptic sites and branch points is significantly lower in VNC compared to mushroom body. D-H: Typical trajectories of presynaptic and postsynaptic terminal branches. D shows 3D digital models of four neighboring presynaptic neurites (1–4). Neurite 1 has a varicosity near top of panel (arrow); varicosities of the other neurites are more basally. E: bundle of dendritiform neurites extending in vicinity of terminal axons shown in D. F: terminal axons and dendrites shown together. G, H: EM sections close to top and bottom of VNC microvolume (levels of section shown in D). Profiles corresponding to the elements shown in models D-F are shaded in corresponding colors. As shown here, groups of dendritiform neurites (typically ranging between 6 and 10) form tight bundles in between adjacent preterminal axons (arrow in E, G). After forming synaptic contacts, dendritiform neurites typically splay apart (E) to then regroup with other dendrites in different configurations. Bar: 1µm
Fig. 6
Fig. 6
Network motifs that are most frequently encountered in micro-volumes. A-C: Dense overlapping regulon motif. A: Segment of one “primary” presynaptic element (turquoise; varicose neurite) which contacts five postsynaptic elements (dendritiform neurites) at two synapses. B: Same configuration of pre- and postsynaptic elements as in A; several other “secondary” presynaptic elements (green) which form synapses with the same dendrites as the primary axon are shown. C: schematic representation of this network motif. D-H: Feed forward motif. D, E, F: 3D digital models and schematic modelof segments of three varicose neurites which form predominantly presynaptic contacts (terminal axons). The blue element has a thin branch that is postsynaptic to the light-green element (white arrow in D-F). Shown are also the dendritiform postsynaptic neurites that are postsynaptic to both green and blue varicose neurites. G, H: EM sections at levels shown by lines in panel D. G represents top level and shows the synapse between pre-/postsynaptic element (blue) and presynaptic element (green; arrow). Bar: 1µm
Fig. 7
Fig. 7
Parameters of microcircuitry in mammalian neocortex and Drosophila brain. A-C: Representative EM sections of mouse neocortex (A), Drosophila larval brain (B) and Drosophila adult brain (C) shown at the same scale. Red dots in A and B indicate profiles of individual sectioned neurites. D: Frequency distribution of neurites with different diameters in mammalian cortex and Drosophila brain. Indicated are also the range of diameters that correspond to different neuropile elements (yellow/orange: dendrites; green/blue: axons). E: Comparison of several core parameters in mouse and Drosophila neuropile. In both systems, terminal axons are varicose neurites which form presynaptic sites on their varicosities. Diameters of varicosities are in the range of 0.5 to 1.5µm (average in mouse: 0.7µm; in Drosophila: 0.9µm); the thin segments of terminal axons have an average diameter of approximately 0.33µm. The diameter of synapses (presynaptic sites) is also quite similar in both systems (0.32µm in mammalian cortex, 0.25µm in fly brain. Also the overall cable length of terminal axons per volume unit is comparable: 4,100µm per 1000µm3 in mouse, and between 1500 and 4,000µm in different micro-volumes of fly brain. The major difference between mouse and fly neuropile lies in the size and branching density of dendrites. In Drosophila, dendrites are very thin (average diameter: 0.13µm) and densely branched; in mammalian brain, dendrites are thick (average diameter: 0.9µm; see even thicker examples of dendrites in panel A) and branches are much further apart. This is also reflected in the dendritic cable length which is 450mm per 1000µm3 in mouse and more than 10fold higher in Drosophila. Lower branch density as well as the absence of polyadic synapses in mouse cortex neuropile also results in a considerably less dense connectivity, schematically shown in F. Shown for Drosophila is the dense overlapping regulon motif, in which the large majority of neurite segments encountered in any micro-volume of 100µm3 or more is engaged. In a mammalian cortical micro-volume of that size, dendrite segments are unbranched; the only type of connectivity is convergence, whereby multiple terminal axons converge on a dendritic segment that happens to be within their range. Bar: 1µm
Fig. 8
Fig. 8
Frequency distribution of neurites with different diameters across multiple phyla. Bottom left: highly schematic phylogenetic diagram depicting basal metazoa and major groups of bilaterians. Top and left: representative EM sections of neuropile of five phyla [chordata: mouse (from Peters et al., 1976); mollusca: pond snail (Nagy and Elekes, 2000); nematoda: C. elegans (White et al., 1986); arthropoda: Drosophila (our material); acoela: Neochildia (our material); all shown at same scale]. Next to EM sections are histograms depicting size distribution of neurite profiles. In all phyla except nematoda, thin profiles (< 0.2µm) represent majority of neurites, followed by intermediate profiles (0.4–0.6µm) and large profiles (> 0.6µm). For details, see text.

Similar articles

Cited by

References

    1. Alon U. Network motifs: theory and experimental approaches. Nat. Rev. Genet. 2007;8:450–461. - PubMed
    1. Baas PW, Yu W. A composite model for establishing the microtubule arrays of the neuron. Mol. Neurobiol. 1996;12:145–161. - PubMed
    1. Braitenberg V, Schüz A. Cortex: Statistics and Geometry of Neuronal Connectivity. 2nd. Springer: Berlin Heidelberg; 1998.
    1. Brand AH, Perrimon N. Targeted gene expression as a means of altering cell fates and generating dominant phenotypes. Development. 1993;118:401–415. - PubMed
    1. Cardona A, Saalfeld S, Preibisch S, Schindelin J, Tomancak P, Cheng A, Potter C, Carragher B, Hartenstein V. Micro- and macroarchitectural analysis of fly brain by computer-assisted serial section electron microscopy. 2009 in preparation. - PMC - PubMed

Publication types

MeSH terms

LinkOut - more resources