Central role of IFNgamma-indoleamine 2,3-dioxygenase axis in regulation of interleukin-12-mediated antitumor immunity
- PMID: 20028855
- PMCID: PMC2805056
- DOI: 10.1158/0008-5472.CAN-09-3170
Central role of IFNgamma-indoleamine 2,3-dioxygenase axis in regulation of interleukin-12-mediated antitumor immunity
Abstract
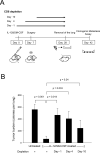
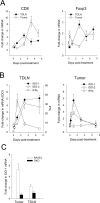
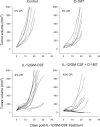
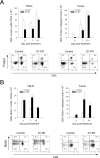
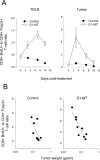
Sustained intratumoral delivery of interleukin-12 (IL-12) and granulocyte macrophage colony-stimulating factor induces tumor regression via restoration of tumor-resident CD8+ T-effector/memory cell cytotoxicity and subsequent repriming of a secondary CD8+ T-effector cell response in tumor-draining lymph nodes (TDLN). However, treatment-induced T-effector activity is transient and is accompanied with a CD4+ CD25+ Foxp3+ T-suppressor cell rebound. Molecular and cellular changes in posttherapy tumor microenvironment and TDLN were monitored to elucidate the mechanism of counterregulation. Real-time PCR analysis revealed a 5-fold enhancement of indoleamine 2,3-dioxygenase (IDO) expression in the tumor and the TDLN after treatment. IDO induction required IFNgamma and persisted for up to 7 days. Administration of the IDO inhibitor D-1-methyl tryptophan concurrent with treatment resulted in a dramatic enhancement of tumor regression. Enhanced efficacy was associated with a diminished T-suppressor cell rebound, revealing a link between IDO activity and posttherapy regulation. Further analysis established that abrogation of the regulatory counterresponse resulted in a 10-fold increase in the intratumoral CD8+ T-cell to CD4+ Foxp3+ T-cell ratio. The ratio of proliferating CD8+ T-effector to CD4+ Foxp3+ T-suppressor cells was prognostic for efficacy of tumor suppression in individual mice. IFNgamma-dependent IDO induction and T-suppressor cell expansion were primarily driven by IL-12. These findings show a critical role for IDO in the regulation of IL-12-mediated antitumor immune responses.
Figures
Similar articles
-
Dichotomous effects of IFN-γ on dendritic cell function determine the extent of IL-12-driven antitumor T cell immunity.J Immunol. 2011 Jul 1;187(1):126-32. doi: 10.4049/jimmunol.1100168. Epub 2011 Jun 1. J Immunol. 2011. PMID: 21632715 Free PMC article.
-
Central role of tumor-associated CD8+ T effector/memory cells in restoring systemic antitumor immunity.J Immunol. 2009 Apr 1;182(7):4217-25. doi: 10.4049/jimmunol.0802793. J Immunol. 2009. PMID: 19299720
-
Tolerogenic Phenotype of IFN-γ-Induced IDO+ Dendritic Cells Is Maintained via an Autocrine IDO-Kynurenine/AhR-IDO Loop.J Immunol. 2016 Aug 1;197(3):962-70. doi: 10.4049/jimmunol.1502615. Epub 2016 Jun 17. J Immunol. 2016. PMID: 27316681
-
Indoleamine 2,3-dioxygenase: is it an immune suppressor?Cancer J. 2010 Jul-Aug;16(4):354-9. doi: 10.1097/PPO.0b013e3181eb3343. Cancer J. 2010. PMID: 20693847 Free PMC article. Review.
-
Indoleamine 2,3-dioxygenase in T-cell tolerance and tumoral immune escape.Immunol Rev. 2008 Apr;222:206-21. doi: 10.1111/j.1600-065X.2008.00610.x. Immunol Rev. 2008. PMID: 18364004 Review.
Cited by
-
Astragaloside IV Inhibits the Proliferation of Human Uterine Leiomyomas by Targeting IDO1.Cancers (Basel). 2022 Sep 12;14(18):4424. doi: 10.3390/cancers14184424. Cancers (Basel). 2022. PMID: 36139584 Free PMC article.
-
Mesenchymal stem cells use IDO to regulate immunity in tumor microenvironment.Cancer Res. 2014 Mar 1;74(5):1576-87. doi: 10.1158/0008-5472.CAN-13-1656. Epub 2014 Jan 22. Cancer Res. 2014. PMID: 24452999 Free PMC article.
-
The tryptophan metabolism enzyme L-kynureninase is a novel inflammatory factor in psoriasis and other inflammatory diseases.J Allergy Clin Immunol. 2016 Jun;137(6):1830-1840. doi: 10.1016/j.jaci.2015.09.055. Epub 2015 Dec 22. J Allergy Clin Immunol. 2016. PMID: 26725996 Free PMC article.
-
IDO in the Tumor Microenvironment: Inflammation, Counter-Regulation, and Tolerance.Trends Immunol. 2016 Mar;37(3):193-207. doi: 10.1016/j.it.2016.01.002. Epub 2016 Jan 31. Trends Immunol. 2016. PMID: 26839260 Free PMC article. Review.
-
Discovery and Preclinical Evaluation of BMS-986242, a Potent, Selective Inhibitor of Indoleamine-2,3-dioxygenase 1.ACS Med Chem Lett. 2021 Jan 28;12(2):288-294. doi: 10.1021/acsmedchemlett.0c00668. eCollection 2021 Feb 11. ACS Med Chem Lett. 2021. PMID: 33603977 Free PMC article.
References
-
- Morse MA, Chui S, Hobeika A, et al. Recent developments in therapeutic cancer vaccines. Nature Clin Practice Oncol. 2005;2:108–13. - PubMed
-
- Finn OJ. Molecular origins of cancer. Cancer Immunology. New Engl J Med. 2008;358:2704–15. - PubMed
-
- Rosenberg SA, Sherry RM, Morton KE, et al. Tumor progression can occur despite the induction of very high levels of self/tumor antigen-specific CD8+ T cells in patients with melanoma. J Immunol. 2005;175:6169–76. - PubMed
-
- Gajewski TF, Meng Y, Harlin H. Immune suppression in the tumor microenvironment. J Immunother. 2006;29:233–40. - PubMed
-
- Vieweg J, Su Z, Dahm P, Kusmartsev S, et al. Reversal of tumor-mediated immunosuppression. Clin Cancer Res. 2007;13:727s–32s. - PubMed
Publication types
MeSH terms
Substances
Grants and funding
LinkOut - more resources
Full Text Sources
Molecular Biology Databases
Research Materials

