

Patient characteristics as predictors of image quality and diagnostic accuracy of MDCT compared with conventional coronary angiography for detecting coronary artery stenoses: CORE-64 Multicenter International Trial
- PMID: 20028910
- PMCID: PMC3294286
- DOI: 10.2214/AJR.09.2833
Patient characteristics as predictors of image quality and diagnostic accuracy of MDCT compared with conventional coronary angiography for detecting coronary artery stenoses: CORE-64 Multicenter International Trial
Abstract
Objective: The purpose of the study was to investigate patient characteristics associated with image quality and their impact on the diagnostic accuracy of MDCT for the detection of coronary artery stenosis.
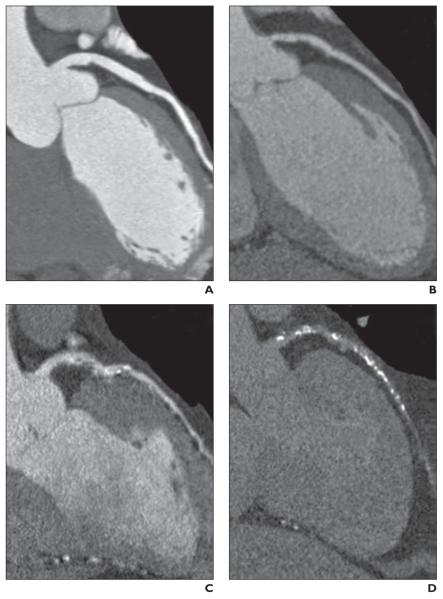
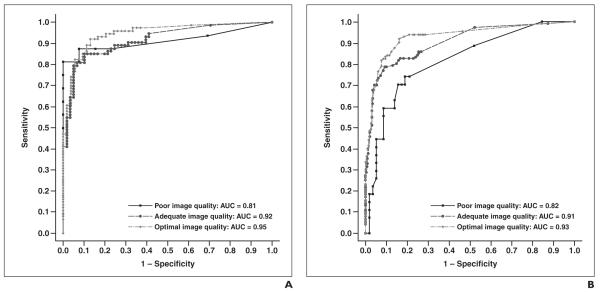
Materials and methods: Two hundred ninety-one patients with a coronary artery calcification (CAC) score of <or=600 Agatston units (214 men and 77 women; mean age, 59.3+/-10.0 years [SD]) were analyzed. An overall image quality score was derived using an ordinal scale. The accuracy of quantitative MDCT to detect significant (>or=50%) stenoses was assessed using quantitative coronary angiography (QCA) per patient and per vessel using a modified 19-segment model. The effect of CAC, obesity, heart rate, and heart rate variability on image quality and accuracy were evaluated by multiple logistic regression. Image quality and accuracy were further analyzed in subgroups of significant predictor variables. Diagnostic analysis was determined for image quality strata using receiver operating characteristic (ROC) curves.
Results: Increasing body mass index (BMI) (odds ratio [OR]=0.89, p<0.001), increasing heart rate (OR=0.90, p<0.001), and the presence of breathing artifact (OR=4.97, p<or=0.001) were associated with poorer image quality whereas sex, CAC score, and heart rate variability were not. Compared with examinations of white patients, studies of black patients had significantly poorer image quality (OR=0.58, p=0.04). At a vessel level, CAC score (10 Agatston units) (OR=1.03, p=0.012) and patient age (OR=1.02, p=0.04) were significantly associated with the diagnostic accuracy of quantitative MDCT compared with QCA. A trend was observed in differences in the areas under the ROC curves across image quality strata at the vessel level (p=0.08).
Conclusion: Image quality is significantly associated with patient ethnicity, BMI, mean scan heart rate, and the presence of breathing artifact but not with CAC score at a patient level. At a vessel level, CAC score and age were associated with reduced diagnostic accuracy.
Figures
Similar articles
-
Predictors of image quality in high-pitch coronary CT angiography.AJR Am J Roentgenol. 2011 Oct;197(4):851-8. doi: 10.2214/AJR.10.6072. AJR Am J Roentgenol. 2011. PMID: 21940572
-
Dual-source CT: effect of heart rate, heart rate variability, and calcification on image quality and diagnostic accuracy.Radiology. 2008 May;247(2):346-55. doi: 10.1148/radiol.2472070906. Epub 2008 Mar 27. Radiology. 2008. PMID: 18372455
-
Noninvasive coronary angiography using 64-slice spiral computed tomography in an unselected patient collective: effect of heart rate, heart rate variability and coronary calcifications on image quality and diagnostic accuracy.Eur J Radiol. 2008 Apr;66(1):134-41. doi: 10.1016/j.ejrad.2007.05.013. Epub 2007 Jun 27. Eur J Radiol. 2008. PMID: 17600648
-
Diagnostic accuracy of dual-source CT coronary angiography: The effect of average heart rate, heart rate variability, and calcium score in a clinical perspective.Acta Radiol. 2010 Sep;51(7):727-40. doi: 10.3109/02841851.2010.492792. Acta Radiol. 2010. PMID: 20707657
-
ECG-gated 16-MDCT of the coronary arteries: assessment of image quality and accuracy in detecting stenoses.AJR Am J Roentgenol. 2005 May;184(5):1413-9. doi: 10.2214/ajr.184.5.01841413. AJR Am J Roentgenol. 2005. PMID: 15855088
Cited by
-
Impact of an intra-cycle motion correction algorithm on overall evaluability and diagnostic accuracy of computed tomography coronary angiography.Eur Radiol. 2016 Jan;26(1):147-56. doi: 10.1007/s00330-015-3793-1. Epub 2015 May 9. Eur Radiol. 2016. PMID: 25953001
-
Influence of cardiac motion on stent lumen visualization in third generation dual-source CT employing a pulsatile heart model.Br J Radiol. 2017 Feb;90(1070):20160616. doi: 10.1259/bjr.20160616. Epub 2016 Nov 29. Br J Radiol. 2017. PMID: 27897030 Free PMC article.
-
Prospective Study of Low-Radiation and Low-Iodine Dose Aortic CT Angiography in Obese and Non-Obese Patients: Image Quality and Impact of Patient Characteristics.Diagnostics (Basel). 2022 Mar 10;12(3):675. doi: 10.3390/diagnostics12030675. Diagnostics (Basel). 2022. PMID: 35328228 Free PMC article.
-
Radiation dose considerations by intra-individual Monte Carlo simulations in dual source spiral coronary computed tomography angiography with electrocardiogram-triggered tube current modulation and adaptive pitch.Eur Radiol. 2012 Mar;22(3):569-78. doi: 10.1007/s00330-011-2300-6. Epub 2011 Oct 9. Eur Radiol. 2012. PMID: 21984448
-
Clinical Utility of Third-generation Dual-source Computed Tomography for Left Ventricular Function Analysis and Coronary Artery Evaluation with Minimal Radiation Exposure.J Cardiovasc Imaging. 2020 Jan;28(1):33-35. doi: 10.4250/jcvi.2019.0113. J Cardiovasc Imaging. 2020. PMID: 31997606 Free PMC article. No abstract available.
References
-
- Garcia MJ, Lessick J, Hoffmann MH, CATSCAN Study Investigators Accuracy of 16-row multide-tector computed tomography for the assessment of coronary artery stenosis. JAMA. 2006;296:403–411. - PubMed
-
- Hoffmann MH, Shi H, Schmitz BL, et al. Noninvasive coronary angiography with multislice computed tomography. JAMA. 2005;293:2471–2478. - PubMed
-
- Mollet NR, Cademartiri F, Nieman K, et al. Multislice spiral computed tomography coronary angiography in patients with stable angina pectoris. J Am Coll Cardiol. 2004;43:2265–2270. - PubMed
-
- Nieman K, Cademartiri F, Lemos PA, Raaijmakers R, Pattynama PM, de Feyter PJ. Reliable noninvasive coronary angiography with fast submillimeter multislice spiral computed tomography. Circulation. 2002;106:2051–2054. - PubMed
-
- Ropers D, Baum U, Pohle K, et al. Detection of coronary artery stenoses with thin-slice multi-detector row spiral computed tomography and multiplanar reconstruction. Circulation. 2003;107:664–666. - PubMed
Publication types
MeSH terms
Grants and funding
LinkOut - more resources
Full Text Sources
Other Literature Sources
Medical
