. 2010 Apr 1;41(2):109-19.
doi: 10.1152/physiolgenomics.00131.2009. Epub 2009 Dec 22.

Regulatory T cell-mediated resolution of lung injury: identification of potential target genes via expression profiling

Affiliations

Regulatory T cell-mediated resolution of lung injury: identification of potential target genes via expression profiling

Neil R Aggarwal et al. Physiol Genomics. .

Erratum in

  • Corrigendum.
    [No authors listed] [No authors listed] Physiol Genomics. 2016 Dec 1;48(12):961. doi: 10.1152/physiolgenomics.zh7-4153-corr.2016. Physiol Genomics. 2016. PMID: 27994048 Free PMC article. No abstract available.

Abstract

In animal models of acute lung injury (ALI), gene expression studies have focused on the acute phase of illness, with little emphasis on resolution. In this study, the acute phase of intratracheal lipopolysaccharide (IT LPS)-induced lung injury was similar in wild-type (WT) and recombinase-activating gene-1-deficient (Rag-1(-/-)) lymphocyte-deficient mice, but resolution was impaired and resolution-phase lung gene expression remained different from baseline only in Rag-1(-/-) mice. By focusing on groups of genes involved in similar biological processes (gene ontologies) pertinent to inflammation and the immune response, we identified 102 genes at days 4 and 10 after IT LPS with significantly different expression between WT and Rag-1(-/-) mice. After adoptive transfer of isolated CD4+CD25+Foxp3+ regulatory T cells (Tregs) to Rag-1(-/-) mice at the time of IT LPS, resolution was similar to that in WT mice. Of the 102 genes distinctly changed in either WT or Rag-1(-/-) mice from our 7 gene ontologies, 19 genes reverted from the Rag-1(-/-) to the WT pattern of expression after adoptive transfer of Tregs, implicating those 19 genes in Treg-mediated resolution of ALI.


Figures
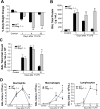
Fig. 1.
Fig. 1.
Resolution of lung injury is impaired in recombinase-activating gene-1 (Rag-1)−/− mice. C57BL/6 (WT) or Rag-1−/− mice were treated with intratracheal lipopolysaccharide (IT LPS) and assessed at intervals. Percent body weight change from baseline (A) and bronchoalveolar lavage (BAL) total protein (B) were significantly increased in Rag-1−/− mice at days 4 and 10 after IT LPS compared with WT mice. Despite similar changes at days 1 and 4 after IT LPS, BAL total cell count (C) was increased in Rag-1−/− mice at day 10. Similarly, BAL differential cell counts (D) demonstrate a persistent neutrophil alveolitis at day 10 in Rag-1−/− mice that has resolved in WT mice. There is a significant increase in BAL lymphocytes in WT mice, most notable at later time points. Rag-1−/− mice do not have lymphocytes. n = 3 at each time point and for each strain. *P < 0.05 compared with other strain at same time point.
Fig. 2.
Fig. 2.
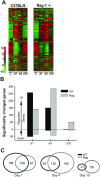
A: heat map of 2,000 genes, common to both WT and Rag-1−/− mice, that demonstrated the largest standard deviation of individual gene expression across both strains for upregulated (red) and downregulated (green) genes at baseline and days 1, 4, and 10 after IT LPS (C, d1, d4, d10 respectively). B: bar graph displays number of significantly changed genes (vs. control gene expression) at each time point after IT LPS in WT and Rag-1−/− (Rag) mice. Fold change (FC) required to achieve significance was ≥ 3.3, ≤ −3.3 compared with control. C: Venn diagram shows number of distinct and common genes at each time point between the 2 groups; black (WT) and gray (Rag-1−/−) circles demonstrate this qualitatively.
Fig. 3.
Fig. 3.
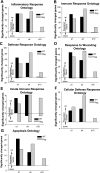
Changes in gene ontologies persist in Rag-1−/− mice. Gene ontology (GO) analysis combines genes involved in the same biological processes and assesses ontology significance based on overall gene expression changes in that ontology, which is based on a minimum z-score >1.96. In each of the 7 ontologies chosen (A–G), significantly up- and downregulated individual genes (FC ≥ 3.3 or ≤ −3.3 vs. control) are graphed. In general, each ontology follows the same general pattern; at day 1, there are at least as many significant WT mouse genes as in Rag-1−/− mice. By day 4 this trend has reversed, and at day 10 a number of Rag-1−/− mouse genes remain significantly different from baseline. Very few genes are different from baseline expression in WT mice by day 10. GOs graphed in A–D are larger umbrella GOs, whereas those graphed in E–G are smaller GOs, made up of a subset of genes from the larger GOs.
Fig. 4.
Fig. 4.
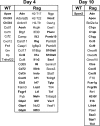
Strain-specific differences in gene expression. Using the 7 ontologies identified, gene symbols listed represent the 102 genes that are distinctly changed from baseline gene expression in WT or Rag-1−/− mice, but not both, at days 4 and 10. Genes in bold are found in multiple ontologies. Overall, there are almost 3-fold more distinct genes at day 4 (76) compared with day 10 (26). At day 4, there are almost 5-fold more significantly changed genes in Rag-1−/− mice compared with WT mice. At day 10, only 1 WT gene (Spon2) is significantly changed; 25 genes remain so in Rag-1−/− mice.
Fig. 5.
Fig. 5.
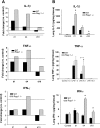
Validation of array data. To compare gene expression for individual genes to their phenotypic response, we used the Bioplex Protein Assay system to measure protein levels in the lung homogenate. Interleukin-1β (IL-1β), tumor necrosis factor-α (TNF-α), and interferon-γ (IFN-γ) are represented by measurements of FC of gene expression compared with control (A) and protein quantification (B). *P < 0.05 compared with the other strain at the same time point. Significant FC ≥ 3.3, ≤ −3.3 are indicated by horizontal lines in A. n = 3 at each time point and for each strain.
Fig. 6.
Fig. 6.
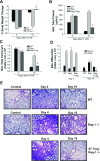
Adoptive transfer of regulatory T cells (Tregs) into Rag-1−/− mice restores normal resolution of lung injury. Phenotypic data from experiments used to generate microarray data after adoptive transfer (AT) of Tregs to Rag-1−/− mice are shown. Body weight change (A), BAL protein (B), BAL total cell count (C), and BAL neutrophils (PMNs; D) all demonstrate that in Rag-1−/− mice that received Tregs lung injury is minimal by day 10 and similar to WT mice; in comparison, Rag-1−/− that did not receive Tregs have persistent lung injury at day 10. Macros, macrophages. Lung histology (E) reveals that Rag-1−/− mice and Rag-1−/− after AT of Tregs have similar histological patterns at day 4; however, AT of Tregs produces normal resolution by day 10. n = 3 at each time point and for each strain. *P < 0.05 comparing Rag-1−/− mice with Tregs to Rag-1−/− mice without Tregs at the same time point.
Fig. 7.
Fig. 7.
Based on the 7 GOs and the resulting 102 genes that show differential changes between WT and Rag-1−/− mice from Fig. 4, listed genes show similar expression in Rag-1−/− mice that received Tregs (AT Rag) and WT mice but distinct from Rag-1−/− mice that did not receive Tregs (Rag), for both days 4 and 10. At day 4, 5 genes from WT and Rag-1−/− mice with Tregs are significantly changed (A), and 7 genes from Rag-1−/− mice without Tregs are significantly changed (B). At day 10, 0 genes from WT and Rag-1−/− mice with Tregs genes are significantly changed, and 7 genes from Rag-1−/− mice without Tregs are significantly changed (C). In total, there are 19 potential target genes identified. D: plotted results represent real-time PCR correlation analysis of 24 samples selected from 2 of the 19 gene candidates. Gene expression levels were measured in Fcgr2b and Hp genes. Solid line depicts the position of exact agreement between real-time PCR and Illumina microarray results. Dashed lines indicate the range between 2 SDs (1.96) of differences between transcript detection by microarray and real-time PCR. Ct, threshold cycle. E: for Fcgr2b, a direct comparison of day 10 gene expression values was made for microarray and RT-PCR techniques for Rag-1−/− mice with and without adoptive transfer of Tregs (E). *P < 0.05 for the labeled comparisons.

References

    1. Acute Respiratory Distress Syndrome Network. Ventilation with lower tidal volumes as compared with traditional tidal volumes for acute lung injury and the acute respiratory distress syndrome. N Engl J Med 342: 1301–1308, 2000. - PubMed
    1. Altemeier WA, Matute-Bello G, Gharib SA, Glenny RW, Martin TR, Liles WC. Modulation of lipopolysaccharide-induced gene transcription and promotion of lung injury by mechanical ventilation. J Immunol 175: 3369–3376, 2005. - PubMed
    1. Belperio JA, Keane MP, Burdick MD, Londhe V, Xue YY, Li K, Phillips RJ, Strieter RM. Critical role for CXCR2 and CXCR2 ligands during the pathogenesis of ventilator-induced lung injury. J Clin Invest 110: 1703–1716, 2002. - PMC - PubMed
    1. Brass DM, Yang IV, Kennedy MP, Whitehead GS, Rutledge H, Burch LH, Schwartz DA. Fibroproliferation in LPS-induced airway remodeling and bleomycin-induced fibrosis share common patterns of gene expression. Immunogenetics 60: 353–369, 2008. - PubMed
    1. Cheadle C, Cho-Chung YS, Becker KG, Vawter MP. Application of z-score transformation to Affymetrix data. Appl Bioinformatics 2: 209–217, 2003. - PubMed

Publication types

MeSH terms

Substances