. 2010 Mar;59(3):588-99.
doi: 10.2337/db09-0796. Epub 2009 Dec 22.

Inhibition of PTP1B restores IRS1-mediated hepatic insulin signaling in IRS2-deficient mice

Affiliations

Inhibition of PTP1B restores IRS1-mediated hepatic insulin signaling in IRS2-deficient mice

Agueda González-Rodríguez et al. Diabetes. 2010 Mar.

Abstract

Objective: Mice with complete deletion of insulin receptor substrate 2 (IRS2) develop hyperglycemia, impaired hepatic insulin signaling, and elevated gluconeogenesis, whereas mice deficient for protein tyrosine phosphatase (PTP)1B display an opposing hepatic phenotype characterized by increased sensitivity to insulin. To define the relationship between these two signaling pathways in the regulation of liver metabolism, we used genetic and pharmacological approaches to study the effects of inhibiting PTP1B on hepatic insulin signaling and expression of gluconeogenic enzymes in IRS2(-/-) mice.

Research design and methods: We analyzed glucose homeostasis and insulin signaling in liver and isolated hepatocytes from IRS2(-/-) and IRS2(-/-)/PTP1B(-/-) mice. Additionally, hepatic insulin signaling was assessed in control and IRS2(-/-) mice treated with resveratrol, an antioxidant present in red wine.

Results: In livers of hyperglycemic IRS2(-/-) mice, the expression levels of PTP1B and its association with the insulin receptor (IR) were increased. The absence of PTP1B in the double-mutant mice restored hepatic IRS1-mediated phosphatidylinositol (PI) 3-kinase/Akt/Foxo1 signaling. Moreover, resveratrol treatment of hyperglycemic IRS2(-/-) mice decreased hepatic PTP1B mRNA and inhibited PTP1B activity, thereby restoring IRS1-mediated PI 3-kinase/Akt/Foxo1 signaling and peripheral insulin sensitivity.

Conclusions: By regulating the phosphorylation state of IR, PTB1B determines sensitivity to insulin in liver and exerts a unique role in the interplay between IRS1 and IRS2 in the modulation of hepatic insulin action.


Figures
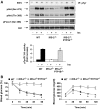
FIG. 1.
FIG. 1.
PTP1B deficiency recovers PI 3-kinase/Akt/Foxo1 insulin signaling in the liver of IRS2-deficient mice. A: Wild-type (WT), IRS2−/−, and IRS2−/−/PTP1B−/− mice (n = 9 animals per genotype) were fasted for 4 h, injected intraperitoneally with PBS or human regular insulin (0.75 units/kg), and killed 15 min later. Livers were removed and total protein extracts were prepared. Then, 600 μg total protein were immunoprecipitated with anti-pTyr antibody and used for an in vitro PI 3-kinase assay. The conversion of PI to PIP3 in the presence of [γ32-P] ATP was analyzed by thin-layer chromatography. Total protein (50 μg) was analyzed by Western blot with the antibodies against phospho-Akt (Ser 473), phospho-Akt (Thr 308), total Akt, and phospho-Foxo (Ser 256). A representative experiment is shown from four independent experiments performed. The autoradiograms showing PI 3-kinase activity were quantitated by scanning densitometry. Results are expressed as fold increase of PI 3-kinase activity and are means ± SEM. *P < 0.05, IRS2−/−/PTP1B−/− vs. IRS2−/−. B: ITT (intraperitoneal injection of 0.75 units/kg human regular insulin) and GTT (intraperitoneal injection of 2 g d-glucose/kg) tests in wild-type, IRS2−/−, and IRS2−/−/PTP1B−/− mice [n = 6–8 per genotype]). Animals were fasted for 4 and 20 h prior to insulin and glucose tolerance tests, respectively. For ITTs, results are expressed as mean ± SEM of percentage of initial blood glucose value. For GTTs, results are expressed as means ± SEM of blood glucose value (mg/dl). *P < 0.05, IRS2−/−/PTP1B−/− vs. IRS2−/−.
FIG. 2.
FIG. 2.
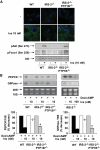
Recovery of insulin signaling and the inhibition of PEPCK and G6Pase in primary hepatocytes from IRS2−/−/PTP1B−/− mice. Primary hepatocytes obtained from mice of each genotype (wild type [WT], IRS2−/−, and IRS2/PTP1B) were cultured as described in research design and methods. A: Cells were serum starved for 4–6 h and further stimulated with 10 nmol/l insulin for 5 min. Upper panel: Cells were fixed in methanol (−20°C), and the generation of PIP3 was measured by confocal immunofluorescence with the anti–PIP3-FITC antibody. Representative images corresponding to primary hepatocytes isolated from one mouse are shown. Lower panel: Cell lysates were prepared, and total protein (50 μg) was used for Western blot analysis with the corresponding antibodies against phospho-Akt (Ser 473), phospho-Foxo (Ser 256), and total Akt. A representative experiment corresponding to primary hepatocytes isolated from one animal is shown from three independent experiments performed in triplicate. B: Cells were cultured in serum-free medium for 4–6 h and further stimulated with dex/cAMP (0.5 mmol/l dibutyril cAMP plus 1 μmol/l dexamethasone) in the absence or presence of insulin (10 or 100 nmol/l) for 6 h. At the end of the culture time, RNA was isolated and submitted to Northern blot analysis. A representative experiment corresponding to primary hepatocytes isolated from one mouse is shown. The autoradiograms corresponding to three independent experiments performed in hepatocytes were quantitated by scanning densitometry. The value of dex/cAMP-treated cells was set to 100%. Results are expressed as percentage of decrease by insulin of PEPCK and G6Pase mRNAs and are means ± SEM. *P < 0.05, IRS2−/−/PTP1B−/− vs. IRS2−/−. (A high-quality digital representation of this figure is available in the online issue.)
FIG. 3.
FIG. 3.
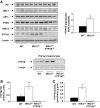
Both PTP1B expression and its enzymatic activity were upregulated in the livers of IRS2−/− mice. A (upper panel): Liver extracts from wild-type (WT), IRS2−/−, and IRS2−/−/PTP1B−/− mice (n = 9 of each genotype) were prepared and total protein (50 μg) was used for Western blot analysis with the corresponding antibodies against insulin-signaling molecules. The anti–β-actin antibody was used as a loading control. A representative experiment is shown. The autoradiograms showing PTP1B from all animals analyzed were quantitated by scanning densitometry. Results are expressed as fold increase of PTP1B content and are means ± SEM. *P < 0.05, IRS2−/− vs. wild type. Lower panel: Primary hepatocytes obtained from mice of each genotype (wild type, IRS2−/−, and IRS2−/−/PTP1B−/−) were cultured as described in research design and methods. Cell lysates were prepared and total protein (50 μg) was used for Western blot analysis with the corresponding antibodies against PTP1B. A representative experiment corresponding to primary hepatocytes isolated from one animal is shown from three independent experiments performed in triplicate. B: Total RNA was isolated from livers of wild-type and IRS2−/− mice (n = 9 of each genotype). PTP1B mRNA levels were determined by real-time PCR. Results are expressed as arbitrary units of PTP1B/18S mRNA and are means ± SEM. *P < 0.05, IRS2−/− vs. wild type. mRNA from IRS2−/−/PTP1B−/− mice was used as a negative control. C: PTP1B activity was measured in wild-type and IRS2−/− liver extracts (n = 5 of each genotype) as described in research design and methods. Results are expressed as pmol · min−1 · μg protein−1 and are means ± SEM. PTP1B activity from IRS2−/−/PTP1B−/− liver extracts was used as a negative control. *P < 0.05, IRS2−/− vs. wild type.
FIG. 4.
FIG. 4.
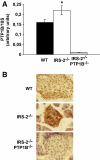
Both PTP1B mRNA and protein levels were upregulated in islets of IRS2−/− mice. A: Total RNA was isolated from islets of wild-type (WT) and IRS2−/− mice (n = 8 of each genotype). PTP1B mRNA levels were determined by real-time PCR. Results are expressed as arbitrary units of PTP1B/18S mRNA and are means ± SEM. *P < 0.05, IRS2−/− vs. wild-type mice. mRNA from IRS2−/−/PTP1B−/− mice was used as a negative control. B: Immunostaining with the antibody against PTP1B was performed in pancreas sections from wild-type, IRS2−/−, and IRS2−/−/PTP1B−/− mice (n = 3 animals per genotype). Representative images are shown. (A high-quality digital representation of this figure is available in the online issue.)
FIG. 5.
FIG. 5.
The lack of PTP1B in IRS2−/− mice restored IRS1-mediated PI 3-kinase signaling by releasing an IR/PTP1B association. A: Wild-type (WT), IRS2−/−, and IRS2−/−/PTP1B−/− mice (n = 9 animals per genotype) were fasted for 4 h, injected intraperitoneally with PBS or human regular insulin (Ins) (0.75 units/kg), and killed 15 min later. Livers were removed, and total protein extracts were prepared. Then, 600 μg total protein was immunoprecipitated with anti-IRβ and analyzed by Western blot with anti-pTyr. Total protein (600 μg) was immunoprecipitated with anti-IRS1 antibody and analyzed by Western blot with anti-pTyr and anti–total IRS1 or used for an in vitro PI 3-kinase assay. The conversion of PI to PIP3 in the presence of [γ32-P] ATP was analyzed by TLC. A representative experiment is shown. The autoradiograms showing PI 3-kinase activity were quantitated by scanning densitometry. Results are expressed as fold increase of PI 3-kinase activity and are means ± SEM. *P < 0.05, IRS2−/−/PTP1B−/− vs. IRS2−/−. B: Liver extracts from wild-type, IRS2−/−, and IRS2−/−/PTP1B−/− mice (n = 6 animals per genotype) were prepared and 600 μg total protein were immunoprecipitated with anti-IRβ or anti-IRS1 antibodies and analyzed by Western blot with the anti-PTP1B, anti-IRβ, and anti-IRS1 antibodies. Total protein (50 μg) was analyzed in whole cell lysates by Western blot with the antibody against PTP1B. The autoradiograms showing IR/PTP1B association from all animals analyzed were quantitated by scanning densitometry. Results are expressed as fold increase of IR/PTP1B association and are means ± SEM. *P < 0.05, IRS2−/− vs. wild type.
FIG. 6.
FIG. 6.
Treatment of IRS2−/− mice with resveratrol downregulated PTP1B in the liver and restored insulin (Ins)-induced Akt/Foxo1 signaling and peripheral insulin sensitivity. A: Liver extracts from IRS2−/− mice treated (IRS-2/Resv) or not (IRS-2/) with resveratrol (n = 8 animals per condition) were fasted for 4 h, injected intraperitoneally (IP) with PBS or human regular insulin (0.75 units/kg), and killed 15 min later. Livers were removed and total protein extracts were prepared. Then, 600 μg total protein was immunoprecipitated with anti-IRS1 antibody analyzed by Western blot with anti-AcLys antibody or used for an in vitro PI 3-kinase (PI 3-K) assay. The conversion of PI to PIP3 in the presence of [γ32-P] ATP was analyzed by thin-layer chromatography. Total protein (50 μg) was analyzed by Western blot with the antibodies against phospho-Akt (pAkt) (Ser 473), phospho-Foxo (Ser 256), total Akt, and PTP1B. A representative experiment is shown from eight independent experiments performed. The autoradiograms showing PI 3-kinase activity were quantitated by scanning densitometry. Results are expressed as fold increase of PI 3-kinase activity and are means ± SEM. *P < 0.05, resveratrol treatment vs. no treatment. B: Total RNA was isolated from livers of IRS2−/− mice treated or not with resveratrol (n = 8 animals per condition). PTP1B mRNA levels were determined by real-time PCR. Results are expressed as arbitrary units of PTP1B/18S mRNA and are means ± SEM. *P < 0.05, treatment vs. no treatment. C: PTP1B activity was measured in liver extracts of IRS2−/− mice treated or not with resveratrol (n = 4 animals per condition) as described in research design and methods. Results are expressed as pmol · min−1 · μg protein−1 and are means ± SEM. *P < 0.05, treated vs. untreated-. D: ITT (injection of 0.75 units/kg human regular insulin) and GTT (injection of 2 g d-glucose/kg) tests in 8- to 12-week-old IRS2−/− mice treated or not with resveratrol (n = 6–8 per genotype). Animals were fasted for 4 and 20 h prior to insulin and glucose tolerance tests, respectively. For ITTs, results are expressed as means ± SEM of percentage of initial blood glucose value. For GTTs, results are expressed as means ± SEM of blood glucose value (mg/dl). *P < 0.05, treated vs. untreated. pAMPK, phosphorylated AMPK; Prot, protein.
FIG. 7.
FIG. 7.
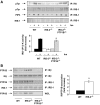
Recovery of insulin (Ins) signaling and the inhibition of PEPCK and G6Pase in primary hepatocytes from resveratrol (Resv)-treated IRS2−/− mice. Primary hepatocytes obtained from mice of each condition (treated or not with resveratrol) were cultured as described in research design and methods. A: Cells were serum starved for 4–6 h and further stimulated with 10 nmol/l insulin for 5 min. After cell lysates were prepared, total protein (50 μg) was used for Western blot analysis with the corresponding antibodies against phospho-Akt (Ser 473), phospho-Foxo (Ser 256), total Akt, and PTP1B. A representative experiment corresponding to primary hepatocytes isolated from one animal is shown from three independent experiments performed in triplicate. B: Cells were cultured in serum-free medium for 4–6 h and further stimulated with dex/cAMP (0.5 mmol/l dibutyril cAMP plus 1 μmol/l dexamethasone) in the absence or presence of insulin (10 nmol/l) for 6 h. At the end of the culture time, RNA was isolated and submitted to Northern blot analysis. A representative experiment corresponding to primary hepatocytes isolated from one mouse is shown. The autoradiograms corresponding to three independent experiments performed in hepatocytes were quantitated by scanning densitometry. The value of dex/cAMP-treated cells was set to 100%. Results are expressed as percentage of decrease by insulin of PEPCK and G6Pase mRNAs and are means ± SEM. *P < 0.05, treated vs. untreated. C: Primary hepatocytes obtained from IRS2−/− mice were cultured as described in research design and methods. Cells were treated with 50 μmol/l resveratrol for 24 h, serum-starved for 2 h, and then stimulated with 10 nmol/l insulin for 5 min. After cell lysates were prepared, total protein (50 μg) was used for Western blot analysis with the corresponding antibodies against phospho-Akt (Ser 473), phospho-Foxo (Ser 256), total Akt, and PTP1B. A representative experiment corresponding to primary hepatocytes isolated from one animal is shown from three independent experiments performed in triplicate.
FIG. 8.
FIG. 8.
Schematic representation of the mechanism by which inhibition of PTP1B promotes insulin sensitivity in the liver of IRS2-deficient mice. The lack of PTP1B promotes insulin sensitivity in the liver of IRS2−/− mice through the restoration of IRS1-mediated Akt/Foxo1 phosphorylation (pAkt and pFoxo1) and the inhibition of gluconeogenic enzymes. This molecular mechanism can be mimicked by resveratrol through downregulation of PTP1B expression and activity in the liver of IRS2−/− mice. PI 3-K, PI 3-kinase.

Similar articles

Cited by

References

    1. White MF: Regulating insulin signaling and beta-cell function through IRS proteins. Can J Physiol Pharmacol 2006; 84: 725– 737 - PubMed
    1. Araki E, Lipes MA, Patti ME, Brüning JC, Haag B, 3rd, Johnson RS, Kahn CR: Alternative pathway of insulin signaling in mice with targeted disruption of the IRS1 gene. Nature 1994; 372: 186– 190 - PubMed
    1. Withers DJ, Gutierrez JS, Towery H, Burks DJ, Ren JM, Previs S, Zhang Y, Bernal D, Pons S, Shulman GI, Bonner-Weir S, White MF: Disruption of IRS2 causes type 2 diabetes in mice. Nature 1998; 391: 900– 904 - PubMed
    1. Withers DJ, Burks DJ, Towery HH, Altamuro SL, Flint CL, White MF: IRS2 coordinates IGF-I receptor-mediated β-cell development and peripheral insulin signaling. Nat Genet 1999; 23: 32– 40 - PubMed
    1. Kubota N, Tobe K, Terauchi Y, Eto K, Yamauchi T, Suzuki R, Tsubamoto Y, Komeda K, Nakano R, Miki H, Satoh S, Sekihara H, Sciacchitano S, Lesniak M, Aizawa S, Nagai R, Kimura S, Akanuma Y, Taylor SI, Kadowaki T: Disruption of insulin receptor substrate 2 causes type 2 diabetes because of liver insulin resistance and lack of compensatory β-cell hyperplasia. Diabetes 2000; 49: 1880– 1889 - PubMed

Publication types

MeSH terms