

Cerebral metabolic alterations in rats with diabetic ketoacidosis: effects of treatment with insulin and intravenous fluids and effects of bumetanide
- PMID: 20028943
- PMCID: PMC2828650
- DOI: 10.2337/db09-0635
Cerebral metabolic alterations in rats with diabetic ketoacidosis: effects of treatment with insulin and intravenous fluids and effects of bumetanide
Abstract
Objective: Cerebral edema is a life-threatening complication of diabetic ketoacidosis (DKA) in children. Recent data suggest that cerebral hypoperfusion and activation of cerebral ion transporters may be involved, but data describing cerebral metabolic alterations during DKA are lacking.
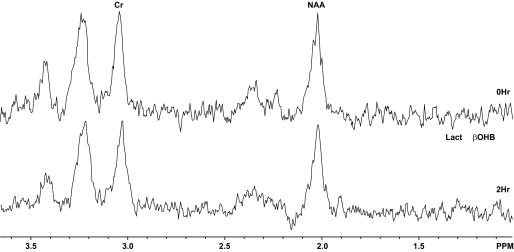
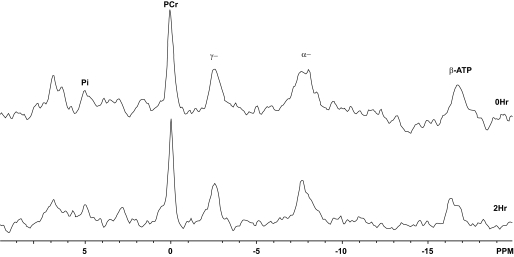
Research design and methods: We evaluated 50 juvenile rats with DKA and 21 normal control rats using proton and phosphorus magnetic resonance spectroscopy (MRS). MRS measured cerebral intracellular pH and ratios of metabolites including ATP/inorganic phosphate (Pi), phosphocreatine (PCr)/Pi, N-acetyl aspartate (NAA)/creatine (Cr), and lactate/Cr before and during DKA treatment. We determined the effects of treatment with insulin and intravenous saline with or without bumetanide, an inhibitor of Na-K-2Cl cotransport, using ANCOVA with a 2 x 2 factorial study design.
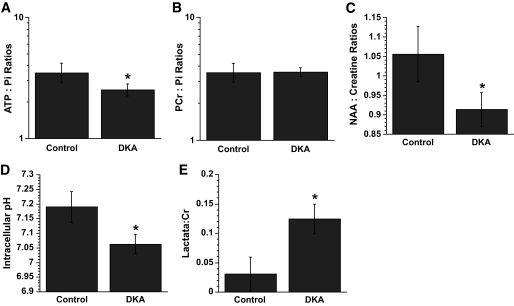
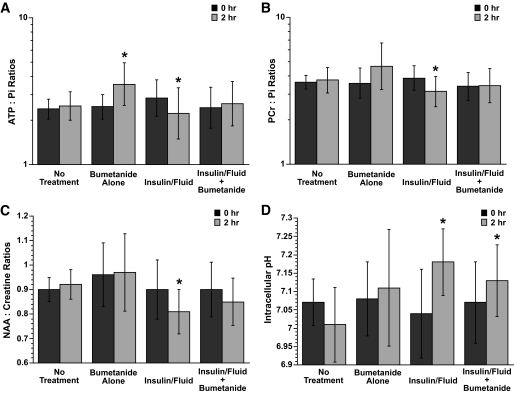
Results: Cerebral intracellular pH was decreased during DKA compared with control (mean +/- SE difference -0.13 +/- 0.03; P < 0.001), and lactate/Cr was elevated (0.09 +/- 0.02; P < 0.001). DKA rats had lower ATP/Pi and NAA/Cr (-0.32 +/- 0.10, P = 0.003, and -0.14 +/- 0.04, P < 0.001, respectively) compared with controls, but PCr/Pi was not significantly decreased. During 2-h treatment with insulin/saline, ATP/Pi, PCr/Pi, and NAA/Cr declined significantly despite an increase in intracellular pH. Bumetanide treatment increased ATP/Pi and PCr/Pi and ameliorated the declines in these values with insulin/saline treatment.
Conclusions: These data demonstrate that cerebral metabolism is significantly compromised during DKA and that further deterioration occurs during early DKA treatment--consistent with possible effects of cerebral hypoperfusion and reperfusion injury. Treatment with bumetanide may help diminish the adverse effects of initial treatment with insulin/saline.
Figures
Similar articles
-
Cerebral blood flow and cerebral edema in rats with diabetic ketoacidosis.Diabetes. 2008 Oct;57(10):2588-94. doi: 10.2337/db07-1410. Epub 2008 Jul 15. Diabetes. 2008. PMID: 18633109 Free PMC article.
-
Effects of hyperglycemia and effects of ketosis on cerebral perfusion, cerebral water distribution, and cerebral metabolism.Diabetes. 2012 Jul;61(7):1831-7. doi: 10.2337/db11-1286. Epub 2012 Apr 12. Diabetes. 2012. PMID: 22498698 Free PMC article.
-
Bumetanide reduces cerebral edema formation in rats with diabetic ketoacidosis.Diabetes. 2005 Feb;54(2):510-6. doi: 10.2337/diabetes.54.2.510. Diabetes. 2005. PMID: 15677509
-
Management of diabetic ketoacidosis in children and adolescents.Paediatr Drugs. 2008;10(4):209-15. doi: 10.2165/00148581-200810040-00002. Paediatr Drugs. 2008. PMID: 18590342 Review.
-
Cerebral oedema in childhood diabetic ketoacidosis: is treatment a factor?Emerg Med J. 2004 Mar;21(2):141-4. doi: 10.1136/emj.2002.001578. Emerg Med J. 2004. PMID: 14988335 Free PMC article. Review.
Cited by
-
Pediatric diabetic ketoacidosis, fluid therapy, and cerebral injury: the design of a factorial randomized controlled trial.Pediatr Diabetes. 2013 Sep;14(6):435-46. doi: 10.1111/pedi.12027. Epub 2013 Mar 13. Pediatr Diabetes. 2013. PMID: 23490311 Free PMC article. Clinical Trial.
-
Current recommendations for management of paediatric diabetic ketoacidosis.Paediatr Child Health. 2023 May 4;28(2):128-138. doi: 10.1093/pch/pxac119. eCollection 2023 May. Paediatr Child Health. 2023. PMID: 37151932 Free PMC article. Review.
-
Brain cell swelling during hypocapnia increases with hyperglycemia or ketosis.Pediatr Diabetes. 2014 Nov;15(7):484-93. doi: 10.1111/pedi.12114. Epub 2014 Jan 20. Pediatr Diabetes. 2014. PMID: 24443981 Free PMC article.
-
Brain injury in children with diabetic ketoacidosis: Review of the literature and a proposed pathophysiologic pathway for the development of cerebral edema.Pediatr Diabetes. 2021 Mar;22(2):148-160. doi: 10.1111/pedi.13152. Epub 2020 Dec 3. Pediatr Diabetes. 2021. PMID: 33197066 Free PMC article. Review.
-
Cerebral hyperemia measured with near infrared spectroscopy during treatment of diabetic ketoacidosis in children.J Pediatr. 2013 Oct;163(4):1111-6. doi: 10.1016/j.jpeds.2013.06.008. Epub 2013 Jul 18. J Pediatr. 2013. PMID: 23871731 Free PMC article. Clinical Trial.
References
-
- Lam T, Anderson S, Glaser N, O'Donnell M: Bumetanide reduces cerebral edema formation in rats with diabetic ketoacidosis. Diabetes 2005; 54: 510– 516 - PubMed
-
- Glaser N, Gorges S, Marcin J, Buonocore M, DiCarlo J, Neely E, Barnes P, Bottomly J, Kuppermann N: Mechanism of cerebral edema in children with diabetic ketoacidosis. J Pediatr 2004; 145: 164– 171 - PubMed
-
- Glaser N, Marcin J, Wooton-Gorges S, Buonocore M, Rewers A, Strain J, DiCarlo J, Neely E, Barnes P, Kuppermann N: Correlation of clinical and biochemical findings with DKA-related cerebral edema in children using magnetic resonance diffusion weighted imaging. J Pediatr 2008; 153: 541– 546 - PubMed
Publication types
MeSH terms
Substances
Grants and funding
LinkOut - more resources
Full Text Sources
Medical
Research Materials
Miscellaneous
