. 2010 Feb 19;285(8):5338-46.
doi: 10.1074/jbc.M109.030296. Epub 2009 Dec 22.

Targets of the Tal1 transcription factor in erythrocytes: E2 ubiquitin conjugase regulation by Tal1

Affiliations

Targets of the Tal1 transcription factor in erythrocytes: E2 ubiquitin conjugase regulation by Tal1

Jörn Lausen et al. J Biol Chem. .

Abstract

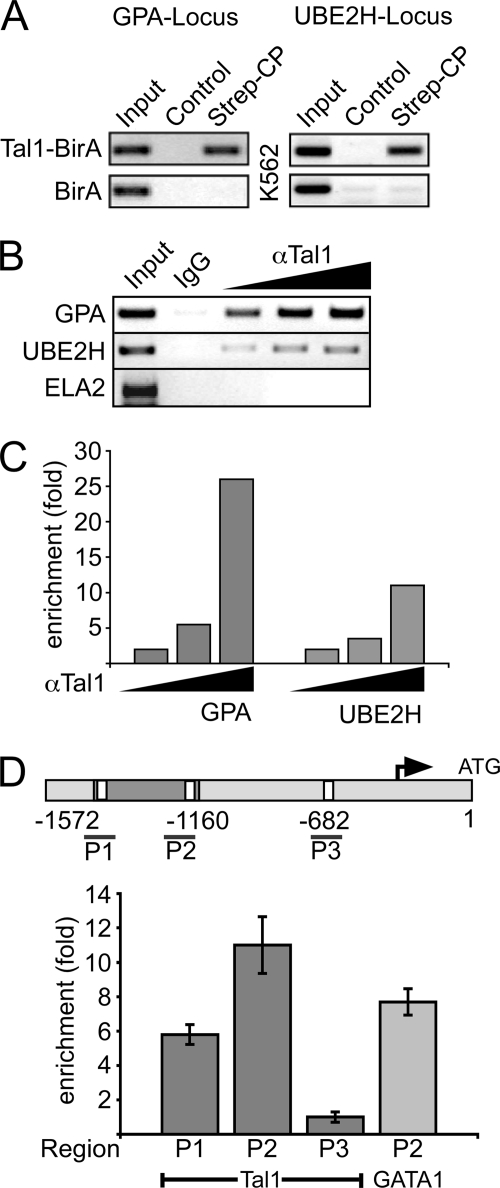
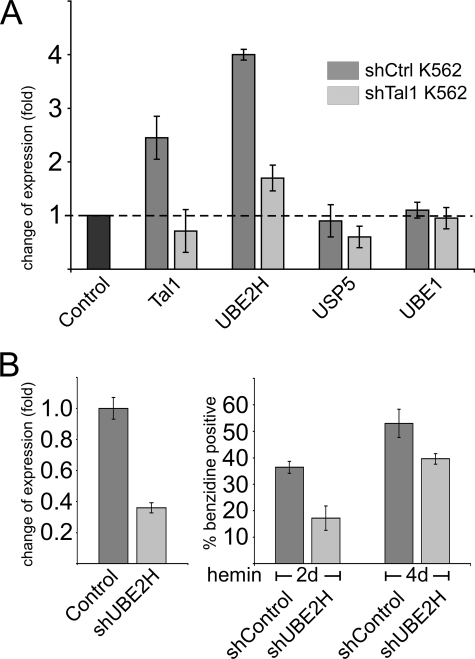
The Tal1 transcription factor is essential for the development of the hematopoietic system and plays a role during definitive erythropoiesis in the adult. Despite the importance of Tal1 in erythropoiesis, only a small number of erythroid differentiation target genes are known. A chromatin precipitation and cloning approach was established to uncover novel Tal1 target genes in erythropoiesis. The BirA tag/BirA ligase biotinylation system in combination with streptavidin chromatin precipitation (Strep-CP) was used to co-precipitate genomic DNA bound to Tal1. Tal1 was found to bind in the vicinity of 31 genes including the E2-ubiquitin conjugase UBE2H gene. Binding of Tal1 to UBE2H was confirmed by chromatin immunoprecipitation. UBE2H expression is increased during erythroid differentiation of hCD34(+) cells. Tal1 expression activated UBE2H expression, whereas Tal1 knock-down reduced UBE2H expression and ubiquitin transfer activity. This study identifies parts of the ubiquitinylation machinery as a cellular target downstream of the transcription factor Tal1 and provides novel insights into Tal1-regulated erythropoiesis.


Figures

FIGURE 1.
FIGURE 1.
Candidate target genes of Tal1. A, localization of the proteins within the cell. The largest number of Tal1 target genes encode for membrane-bound or membrane-associated proteins. Another fraction is cytoplasmatic, and only three genes are predominantly nuclear. For five genes, no data could be obtained concerning their intracellular localization. B, functional categorization of potential target genes. Most potential target genes exhibit catalytic activity, some may modify proteins, and a subset is involved in regulation of the cytoskeleton or calcium signaling. Two genes are involved in ubiquitinylation.
FIGURE 2.
FIGURE 2.
Tal1 knock-down by shRNA reveals effects of Tal1 on candidate target genes. Stable shTal1-K562 cells were established, and the expression of candidate target genes was compared with shRNA control cells. Upon Tal1 knock-down genes were down-regulated (A) and up-regulated (B), respectively. Expression was determined by quantitative RT-PCR and calculated as fold induction (expression level of the shRNA-control-K562 cells was set as 1.0). Values were normalized to the expression level of the housekeeping gene GAPDH. Error bars represent the deviation from four evaluations.
FIGURE 3.
FIGURE 3.
Tal1 target genes expression during hCD34+ erythroid differentiation. Human bone marrow CD34+ cells were expanded for 6 days and subjected to erythroid differentiation in serum-free medium by erythropoietin treatment for 9 days. A, Tal1 expression was five times higher in the Epo-treated cells than in untreated controls. B, erythroid differentiation was accompanied by an increase of GPA, α-globin, and β-globin transcription. C, Tal1 target gene expression in differentiated erythroid cells. Relative expression values are given as fold induction compared with the expression level in uninduced control cells. Values were normalized to the expression level of the housekeeping gene GAPDH. Error bars represent the deviation from four evaluations. Nd, expression not detectable.
FIGURE 4.
FIGURE 4.
Tal1 binding to the UBE2H locus. A, Strep-CP using specific primers for the GPA locus (left) or the UBE2H locus (right) was performed. Cells that only expressed the BirA ligase but not the BirA-tagged Tal1 construct were used as negative controls (BirA). B, conventional ChIP assay and PCR of the UBE2H locus using wild-type K562 cells and increasing amounts of an anti-Tal1 antibody (1, 2.5, and 5 μg). ChIP-PCR reactions targeting the GPA locus and the neutrophile elastase 2 (ELA2) locus served as positive and negative controls, respectively. C, quantitative anti-Tal1 ChIP-PCR showing the enrichment (fold) compared with signals obtained with the negative control. D, Tal1 and GATA1 binding to the cloned region. Upper part, scheme of the 5′ region of the UBE2H gene. The cloned region is between −1572 and −1160 with respect to translational initiation. One primer pair (P1) covering the −1543 E-box site, a primer pair (P2) covering the −1171 E-box site, and third primer pair (P3) further downstream was used. Dark gray, UBE2H 5′ region cloned by Strep-CP. White boxes, E-box sites. Lower part, real-time PCR ChIP quantification. Best enrichment upon Tal1 ChIP was obtained with the primer pair P2 within the cloned region. GATA1 binding could also be detected at the 5′-UBE2H region. Values were obtained from two independent experiments, normalized to the input DNA (to correct for PCR efficiencies), and expressed as fold enrichment compared with the signal obtained with the isotype control.
FIGURE 5.
FIGURE 5.
Tal1 regulates UBE2H expression. A, transient ectopic expression of Tal1 increases endogenous UBE2H expression. A Tal1-IRES-GFP vector was transfected transiently into K562 cells, GFP-positive cells were isolated, and the relative expression levels of GPA and UBE2H were determined by quantitative RT-PCR. Expression levels are shown as -fold induction compared with cells transfected with empty IRES-GPF-vector. B, transient down-regulation of Tal1 results in a decrease of endogenous UBE2H expression. A vector expressing GFP and shRNAs interfering with Tal1 expression were transfected into K562 cells. Transfected cells were isolated by GFP sorting 2 days after transfection. Expression levels were determined by quantitative RT-PCR. Two independent shRNAs reduced Tal1 expression. Tal1 knock-down also diminished GPA and UBE2H expression, but not G6PDH expression. The relative amount of transcripts is shown as fold induction compared with cells transfected with an sh-control vector only. All values were normalized to the GAPDH level and represent values from three independent determinations performed in duplicate. C, stable shTal1-K562 knock-down cells showed a reduced amount of Tal1 protein. D, chromatin immunoprecipitation shows diminished binding of Tal1 to the UBE2H locus in shTal1-K562 knock-down cells. ChIP with a sh-control cell line and with the Tal1 target gene GPA served as positive controls. ChIP with IgG and an αGFP antibody were used as negative controls. The experiments shown represent one of three independent ChIP assays performed. E, expression of the E2 ubiquitin conjugase UBE2H is reduced in the stable shTal1 knock-down cells. Expression of the E1 ligase UBE1 and the ubiquitin-specific peptidase USP5 remains unchanged. F, expression of E2 ubiquitin conjugases in stable shTal1-K562 knock-down cells. The expression of UBE2H, UBE2D2, and UBE2L3 was reduced by more than 50% in the Tal1 knock-down cells. Relative expression was determined by real-time PCR. Error bars represent variation from three independent determinations performed in duplicate.
FIGURE 6.
FIGURE 6.
Tal1-dependent up-regulation of UBE2H upon erythroid differentiation. A, induction of Tal1 and UBE2H in butyrate-induced control K562 cells and unaltered expression of Tal1 and UBE2H in shTal1-K562 knock-down cells. Cells were treated with 2 mm sodium butyrate for 2 days to induce erythroid differentiation. Expression levels were determined by quantitative RT-PCR. Values are expressed in fold induction compared with the expression level before induction (independent triplicates). Note that the absolute expression levels differ as shown in Fig. 5. B, influence of UBE2H on hemoglobin synthesis. Stable shUBE2H-K562 cells show a reduced UBE2H transcript level (left side). The shUBE2H-K562 cells show a lower number of benzidine-positive cells upon hemin (30 μm) induction (right side).
FIGURE 7.
FIGURE 7.
Tal1-dependent up-regulation of ubiquitinylation upon erythroid differentiation. A, ubiquitin transfer activity after sodium butyrate-induced erythroid differentiation of K562 cells. Extracts from cells were incubated with histone H2A and Myc-tagged ubiquitin for 1 h. Immunoblotting with anti-Myc antibody was performed to detect ubiquitin conjugates and immunoblotting against tubulin was included as a loading control (not shown). B, decreased ubiquitin transfer activity of shTal1-K562 cells. Immunoblots were quantified on an Odyssey scanner system (LI-COR). Error bars represent the standard deviation from at least two independent determinations. Stars (*) indicate free ubiquitin molecules.

Similar articles

Cited by

References

    1. Orkin S. H. (2000) Nat. Rev. Genet. 1, 57–64 - PubMed
    1. Cantor A. B., Orkin S. H. (2002) Oncogene 21, 3368–3376 - PubMed
    1. Gottgens B. (2004) Vox Sang 87, Suppl. 1, 15–19 - PubMed
    1. Smale S. T. (2003) Nat. Immunol. 4, 607–615 - PubMed
    1. Passegué E., Jamieson C. H., Ailles L. E., Weissman I. L. (2003) Proc. Natl. Acad. Sci. U.S.A. 100, Suppl. 1, 11842–11849 - PMC - PubMed

Publication types

MeSH terms

LinkOut - more resources