

Adiponectin promotes macrophage polarization toward an anti-inflammatory phenotype
- PMID: 20028977
- PMCID: PMC2825410
- DOI: 10.1074/jbc.M109.088708
Adiponectin promotes macrophage polarization toward an anti-inflammatory phenotype
Abstract
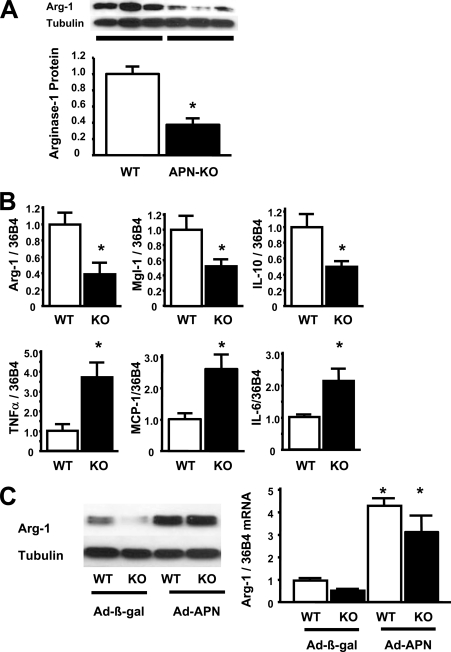
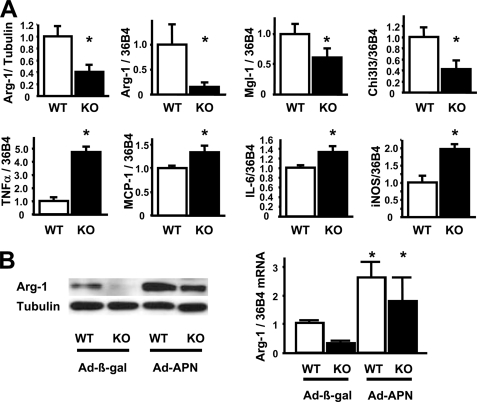
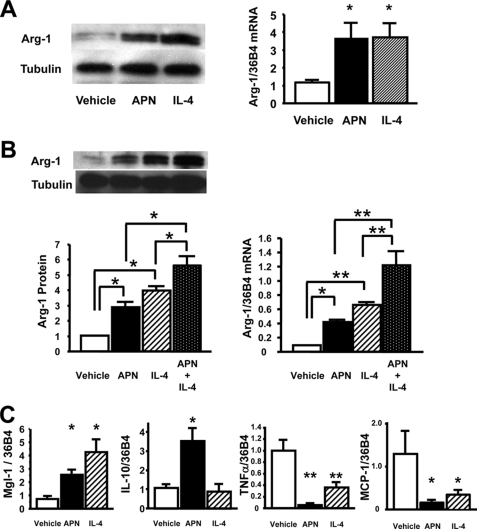
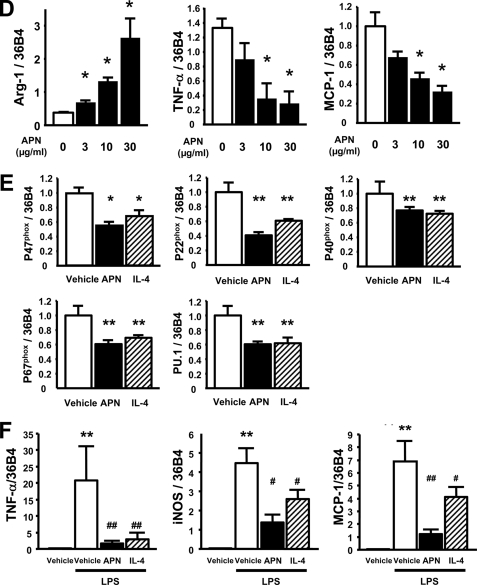
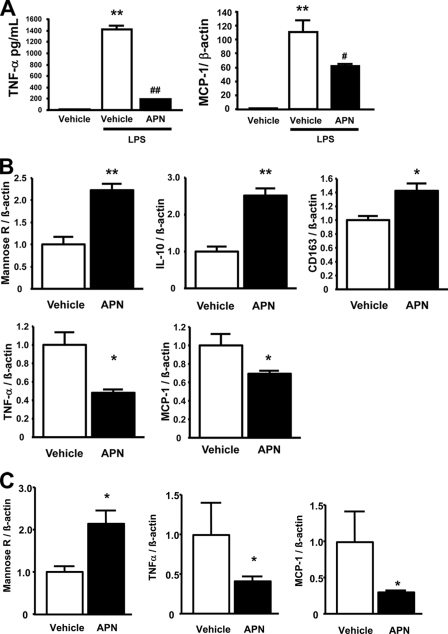
It is established that the adipocyte-derived cytokine adiponectin protects against cardiovascular and metabolic diseases, but the effect of this adipokine on macrophage polarization, an important mediator of disease progression, has never been assessed. We hypothesized that adiponectin modulates macrophage polarization from that resembling a classically activated M1 phenotype to that resembling alternatively-activated M2 cells. Peritoneal macrophages and the stromal vascular fraction (SVF) cells of adipose tissue isolated from adiponectin knock-out mice displayed increased M1 markers, including tumor necrosis factor-alpha, interleukin-6, and monocyte chemoattractant protein-1 and decreased M2 markers, including arginase-1, macrophage galactose N-acetyl-galactosamine specific lectin-1, and interleukin-10. The systemic delivery of adenovirus expressing adiponectin significantly augmented arginase-1 expression in peritoneal macrophages and SVF cells in both wild-type and adiponectin knock-out mice. In culture, the treatment of macrophages with recombinant adiponectin protein led to an increase in the levels of M2 markers and a reduction of reactive oxygen species and reactive oxygen species-related gene expression. Adiponectin also stimulated the expression of M2 markers and attenuated the expression of M1 markers in human monocyte-derived macrophages and SVF cells isolated from human adipose tissue. These data show that adiponectin functions as a regulator of macrophage polarization, and they indicate that conditions of high adiponectin expression may deter metabolic and cardiovascular disease progression by favoring an anti-inflammatory phenotype in macrophages.
Figures
Similar articles
-
Adiponectin primes human monocytes into alternative anti-inflammatory M2 macrophages.Am J Physiol Heart Circ Physiol. 2010 Sep;299(3):H656-63. doi: 10.1152/ajpheart.00115.2010. Epub 2010 Jul 9. Am J Physiol Heart Circ Physiol. 2010. PMID: 20622108 Free PMC article.
-
Impaired macrophage autophagy increases the immune response in obese mice by promoting proinflammatory macrophage polarization.Autophagy. 2015;11(2):271-84. doi: 10.1080/15548627.2015.1009787. Autophagy. 2015. PMID: 25650776 Free PMC article.
-
Macrophage polarization phenotype regulates adiponectin receptor expression and adiponectin anti-inflammatory response.FASEB J. 2015 Feb;29(2):636-49. doi: 10.1096/fj.14-253831. Epub 2014 Nov 12. FASEB J. 2015. PMID: 25392268 Free PMC article.
-
Diversity and plasticity of microglial cells in psychiatric and neurological disorders.Pharmacol Ther. 2015 Oct;154:21-35. doi: 10.1016/j.pharmthera.2015.06.010. Epub 2015 Jun 27. Pharmacol Ther. 2015. PMID: 26129625 Review.
-
Macrophage polarization and function with emphasis on the evolving roles of coordinated regulation of cellular signaling pathways.Cell Signal. 2014 Feb;26(2):192-7. doi: 10.1016/j.cellsig.2013.11.004. Epub 2013 Nov 9. Cell Signal. 2014. PMID: 24219909 Review.
Cited by
-
Adiponectin as a potential biomarker of vascular disease.Vasc Health Risk Manag. 2015 Jan 16;11:55-70. doi: 10.2147/VHRM.S48753. eCollection 2015. Vasc Health Risk Manag. 2015. PMID: 25653535 Free PMC article. Review.
-
Increased saturated fatty acids in obesity alter resolution of inflammation in part by stimulating prostaglandin production.J Immunol. 2013 Aug 1;191(3):1383-92. doi: 10.4049/jimmunol.1203369. Epub 2013 Jun 19. J Immunol. 2013. PMID: 23785121 Free PMC article.
-
Obesity and pulmonary arterial hypertension: Is adiponectin the molecular link between these conditions?Pulm Circ. 2011 Oct-Dec;1(4):440-7. doi: 10.4103/2045-8932.93542. Pulm Circ. 2011. PMID: 22530098 Free PMC article.
-
Expression of the novel adipokine C1qTNF-related protein 4 (CTRP4) suppresses colitis and colitis-associated colorectal cancer in mice.Cell Mol Immunol. 2016 Sep;13(5):688-99. doi: 10.1038/cmi.2016.16. Epub 2016 Apr 18. Cell Mol Immunol. 2016. PMID: 27086950 Free PMC article.
-
Adiponectin restrains ILC2 activation by AMPK-mediated feedback inhibition of IL-33 signaling.J Exp Med. 2021 Feb 1;218(2):e20191054. doi: 10.1084/jem.20191054. J Exp Med. 2021. PMID: 33104171 Free PMC article.
References
-
- Gordon S. (2007) Eur. J. Immunol. 37, S9–S17 - PubMed
Publication types
MeSH terms
Substances
Grants and funding
LinkOut - more resources
Full Text Sources
Other Literature Sources
Molecular Biology Databases
Research Materials
