. 2010 Mar 5;285(10):7016-27.
doi: 10.1074/jbc.M109.047720. Epub 2009 Dec 22.

Mycobacterium tuberculosis cAMP receptor protein (Rv3676) differs from the Escherichia coli paradigm in its cAMP binding and DNA binding properties and transcription activation properties

Affiliations

Mycobacterium tuberculosis cAMP receptor protein (Rv3676) differs from the Escherichia coli paradigm in its cAMP binding and DNA binding properties and transcription activation properties

Melanie Stapleton et al. J Biol Chem. .

Abstract

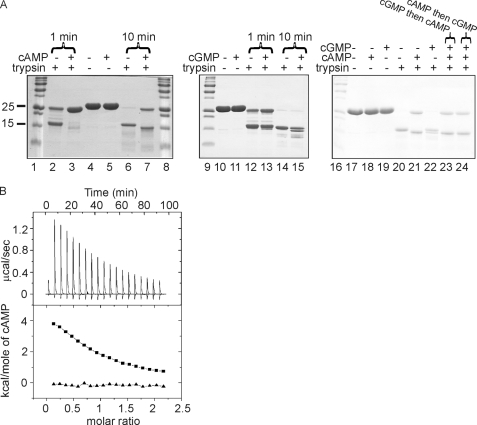
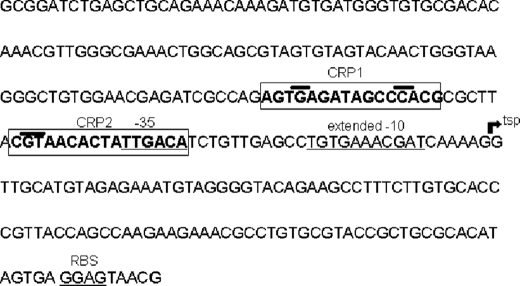
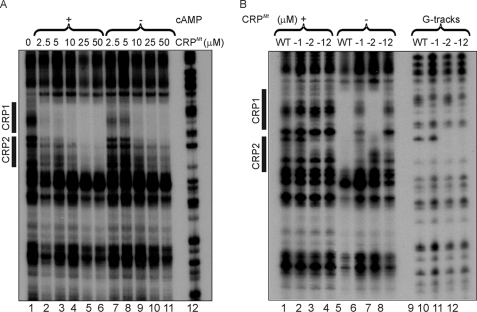
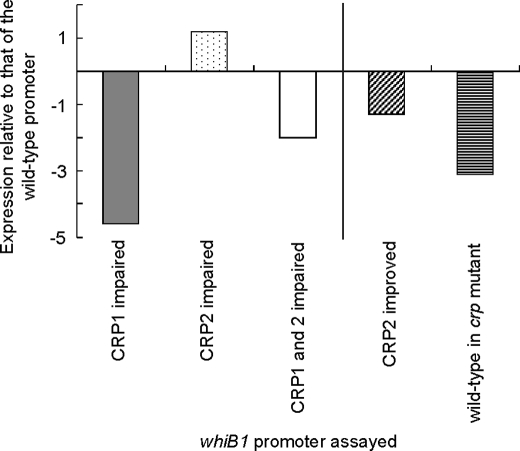
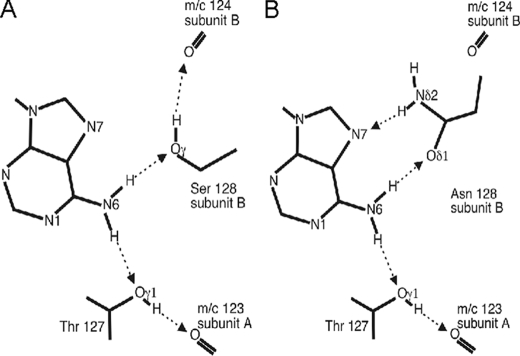
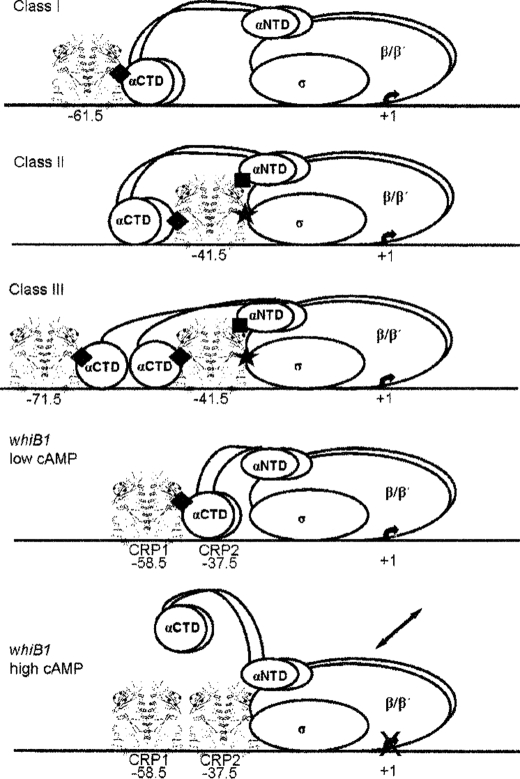
The pathogen Mycobacterium tuberculosis produces a burst of cAMP upon infection of macrophages. Bacterial cyclic AMP receptor proteins (CRP) are transcription factors that respond to cAMP by binding at target promoters when cAMP concentrations increase. Rv3676 (CRP(Mt)) is a CRP family protein that regulates expression of genes (rpfA and whiB1) that are potentially involved in M. tuberculosis persistence and/or emergence from the dormant state. Here, the CRP(Mt) homodimer is shown to bind two molecules of cAMP (one per protomer) at noninteracting sites. Furthermore, cAMP binding by CRP(Mt) was relatively weak, entropy driven, and resulted in a relatively small enhancement in DNA binding. Tandem CRP(Mt)-binding sites (CRP1 at -58.5 and CRP2 at -37.5) were identified at the whiB1 promoter (PwhiB1). In vitro transcription reactions showed that CRP1 is an activating site and that CRP2, which was only occupied in the presence of cAMP or at high CRP(Mt) concentrations in the absence of cAMP, is a repressing site. Binding of CRP(Mt) to CRP1 was not essential for open complex formation but was required for transcription activation. Thus, these data suggest that binding of CRP(Mt) to the PwhiB1 CRP1 site activates transcription at a step after open complex formation. In contrast, high cAMP concentrations allowed occupation of both CRP1 and CRP2 sites, resulting in inhibition of open complex formation. Thus, M. tuberculosis CRP has evolved several distinct characteristics, compared with the Escherichia coli CRP paradigm, to allow it to regulate gene expression against a background of high concentrations of cAMP.


Figures

FIGURE 1.
FIGURE 1.
Characterization of cAMP binding by CRPMt. A, digestion of CRPMt (15 μg) by trypsin (1 μg) in the presence and absence of cAMP or cGMP (2 mm). The composition of the reaction mixtures is indicated above each lane of typical Coomassie Blue-stained SDS-polyacrylamide gels. For lanes 2, 3, 12, and 13, the reactions were incubated at 37 °C for 1 min. For all other lanes, the reactions were incubated at 37 °C for 10 min. Lanes 1, 8, 9, and 16 are molecular mass markers; the sizes (kDa) of the relevant markers are shown on the left (the full set is 250, 150, 100, 75, 50, 37, 25, 20, 15, and 10 kDa, from top to bottom). CRPMt migrates just above the 25-kDa marker. Lane 23 shows a reaction in which CRPMt was preincubated for 10 min with cGMP before adding cAMP and trypsin, indicated by cGMP then cAMP. Lane 24 shows a reaction in which CRPMt was preincubated for 10 min with cAMP before adding cGMP and trypsin, indicated by cAMP then cGMP. B, analysis of cAMP binding by isothermal calorimetry. The upper panel shows the raw binding heats. Integrations of these peaks with respect to time and correction to a per mol basis yield the binding isotherm shown in the lower panel (squares). Also shown in the lower panel (triangles) are the heats of ligand dilution.
FIGURE 2.
FIGURE 2.
Nucleotide sequence of the whiB1 promoter region (PwhiB1). Diagram of the nucleotide sequence of PwhiB1 showing the transcript start (tsp) and its associated extended −10 region and −35 region (underlined), two CRPMt-binding sites (boxed), and the ribosome-binding site (RBS). The locations of the nucleotides within the CRPMt-binding sites that were replaced to impair the sites as indicated in the text are overlined.
FIGURE 3.
FIGURE 3.
Identification of two CRPMt-binding sites within PwhiB1. A, whiB1 promoter (PwhiB1) has two CRPMt-binding sites. Lanes 2–6 show reactions in the presence of 2 mm cAMP; lanes 7–11 show reactions in the absence of cAMP. Lane 1 shows no CRPMt; lanes 2 and 7 show 2.5 μm CRPMt; lanes 3 and 8 show 5 μm CRPMt; lanes 4 and 9 show 10 μm CRPMt; lanes 5 and 10 show 25 μm CRPMt; lanes 6 and 11 show 50 μm CRPMt; lane 12 shows Maxam and Gilbert G track. WT, wild type. B, mutation of PwhiB1 CRP1 impairs binding of CRPMt to CRP2. All reactions contained cAMP (2 mm). Lanes 1–4 show reactions of the indicated promoter variants in the absence of CRPMt as follows: −1, CRP1 site impaired (AGTGAGATAGCCCACG to AGTtAGATAGCCaACG); −2, CRP2 site impaired (CGTAACACTATTGACA to CcaAACACTATTGACA), and −12, both sites impaired. Lanes 5–8, DNase I footprints in the presence of 50 μm CRPMt. Lanes 9–12, Maxam and Gilbert G tracks. The locations of the CRP1 and CRP2 sites (see Fig. 2) are indicated by boxes. The footprints shown are typical of at least three experiments.
FIGURE 4.
FIGURE 4.
In vitro transcription from PwhiB1 is activated by CRPMt occupation of CRP1 and inhibited by CRPMt occupation of CRP2. Reactions were carried out as described under “Experimental Procedures” with the amounts of CRPMt used shown below each lane. A, typical autoradiograph showing the effects of increasing concentrations of CRPMt on whiB1 transcription in vitro. B, using the control as the standard, the relative amount of whiB1 transcript in each of the reactions shown in A was quantified and plotted as a histogram. Open bars, no cAMP; filled bars, 2 mm cAMP. C, autoradiograph showing the effects of mutation of the whiB1 CRPMt-binding sites on transcription. The whiB1 promoter variants are as described in Fig. 3B. The control and the whiB1 transcript are indicated. WT, wild type. D, using the amount of transcript formed in the absence of CRPMt as the base line, the amount of transcript formed under the indicated conditions was quantified and plotted as a histogram (black bars, wild-type promoter; gray bars, CRP1 impaired; stippled bars, CRP2 impaired; open bars, CRP1 and CRP2 impaired). The in vitro transcriptions shown are typical of at least three experiments. The amount of transcription relative to that observed in the absence of CRPMt was calculated by dividing the mean of the test condition by that measured in the absence of CRPMt and expressing this value as a fold difference.
FIGURE 5.
FIGURE 5.
M. tuberculosis CRP activates whiB1 transcription after open complex formation. A, permanganate footprints were obtained with PwhiB1 in the presence and absence of M. smegmatis RNAP and CRPMt. Lanes 1 and 6 show CRPMt 2.5 μm only; lanes 2 and 7 show CRPMt 20 μm only; lanes 3 and 8 show RNAP only; lanes 4 and 9 show RNAP plus CRPMt 2.5 μm; lanes 5 and 10 show RNAP plus CRPMt 20 μm; lane 11 shows Maxam and Gilbert G track. Lanes 1–5 show reactions in the absence of cAMP; lanes 6–10 show reactions in the presence of cAMP (2 mm). The location of the −10 element is indicated. B, DNase I footprint of PwhiB1 in the presence of an activating concentration of CRPMt (2.5 μm) and RNAP. Lanes 1 and 2 show no protein; lanes 3 and 4 show CRPMt; lanes 5 and 6 show CRPMt plus RNAP; lane 7 shows Maxam and Gilbert G track. The locations of the CRP1 (protected) and CRP2 (unprotected) sites are indicated by filled rectangles, as is the region of protection afforded by RNAP. The location of the −10 element is also marked. The hypersensitive site within CRP2 that appears in the presence of RNAP is indicated by the arrow. The footprints shown are typical of at least three experiments.
FIGURE 6.
FIGURE 6.
Patterns of whiB1 expression in vivo match those seen in vitro. β-Galactosidase assays were performed on cell extracts from M. tuberculosis H37Rv strains containing constructs with PwhiB1 promoter linked to the lacZ reporter gene. These were as follows: the unaltered PwhiB1 (wild-type), PwhiB1 with the CRP1 site impaired (CRP1 impaired), PwhiB1 with the CRP2 site impaired (CRP2 impaired), and PwhiB1 with both the CRP1 and CRP2 sites impaired (CRP1 and 2 impaired). The effects of the mutations made in the CRP sites are shown as expression relative to that of the unaltered wild-type promoter to allow direct comparison with the in vitro transcription assays in Fig. 4D. Thus, the result for PwhiB1 with an impaired CRP1 site is shown as a gray bar; the result for PwhiB1 with an impaired CRP2 site is shown as a stippled bar, and the result for PwhiB1 with impaired CRP1 and CRP2 sites is shown as an open bar. In addition, on the right of the figure, the effect of improving the CRP2 site of PwhiB1 (CRP2 improved; diagonal stripes) as well as expression from unaltered PwhiB1 in H37Rv ΔRv3676 (wild-type in crp mutant strain; horizontal stripes) is shown. The values shown are calculated from the mean β-galactosidase activities from three bacterial cultures. All assays were done in triplicate and varied by <15%. The expression relative to the unaltered whiB1 promoter in M. tuberculosis H37Rv was calculated by dividing the mean of the test condition by that obtained for the wild-type promoter and expressing this value as a fold change.
FIGURE 7.
FIGURE 7.
Schematic diagram of hydrogen bonding contacts of the adenine groups of cAMP in the binding pockets of E. coli and M. tuberculosis CRP proteins. A, observed hydrogen bonds between cAMP and E. coli CRP (Protein Data Bank code 2cgp) (45). B, predicted hydrogen bonds between cAMP and CRPMt in which Ser-128 is replaced by Asn. Hydrogen bonds are shown as dotted arrows from donor to acceptor. Atoms referred to in the text are labeled.
FIGURE 8.
FIGURE 8.
Architecture of CRP-dependent promoters. The diagram shows the arrangement of nucleoprotein complexes formed at typical class I, class II, and class III CRP-dependent promoters. At class I promoters, the center of the CRP dimer (shown in ribbon form) is positioned at −61.5, −71.5, −81.5, or −91.5 upstream of the transcript start, placing it on the same face of the DNA helix (horizontal line) as RNAP (shown as unfilled ellipses). This arrangement allows the C-terminal domain of the RNAP α-subunit (α-CTD) to interact directly with activating region 1 (AR1) of the downstream subunit of the CRP dimer (♦). At class II promoters, the CRP dimer is centered at or close to −41.5 and is again on the same face of the DNA helix as RNAP. At these promoters multiple interactions between CRP and RNAP are possible, with contacts between AR1 of the upstream subunit of the CRP dimer and α-CTD, and between activating region 2 (AR2) of the downstream subunit of the CRP dimer and the N-terminal domain of the RNAP α-subunit (α-NTD; ■), and activating region 3 (AR3) of the same CRP subunit and the RNAP σ factor (★). Class III promoters have tandem CRP sites in class I and class II locations allowing AR1, AR2, and AR3 contacts with RNAP. For E. coli CRP, these protein-protein interactions recruit RNAP to CRP-dependent promoters (10). For M. tuberculosis PwhiB1 at low cAMP-CRPMt concentrations, CRP1 is occupied and expression is activated, not by RNAP recruitment but by enhancing a step after open complex formation, i.e. promoter clearance. At high cAMP-CRPMt concentrations, CRP1 and CRP2 are occupied. This arrangement has some similarities with the class III architecture, but because the CRP1 and CRP2 sites are immediately adjacent, there is insufficient space to accommodate the α-CTD between the tandem CRP dimers resulting in inhibition of transcription by preventing α-CTD from docking with DNA thereby inhibiting productive interaction of RNAP with PwhiB1 (indicated by the double-headed arrow).

Similar articles

Cited by

References

    1. Dye C., Scheele S., Dolin P., Pathania V., Raviglione M. C. (1999) J. Am. Med. Assoc. 282, 677–686 - PubMed
    1. Russell D. G. (2001) Nat. Rev. Mol. Cell Biol. 2, 569–577 - PubMed
    1. Stewart G. R., Robertson B. D., Young D. B. (2003) Nat. Rev. Microbiol. 1, 97–105 - PubMed
    1. Cole S. T., Brosch R., Parkhill J., Garnier T., Churcher C., Harris D., Gordon S. V., Eiglmeier K., Gas S., Barry C. E., 3rd, Tekaia F., Badcock K., Basham D., Brown D., Chillingworth T., Connor R., Davies R., Devlin K., Feltwell T., Gentles S., Hamlin N., Holroyd S., Hornsby T., Jagels K., Krogh A., McLean J., Moule S., Murphy L., Oliver K., Osborne J., Quail M. A., Rajandream M. A., Rogers J., Rutter S., Seeger K., Skelton J., Squares R., Squares S., Sulston J. E., Taylor K., Whitehead S., Barrell B. G. (1998) Nature 393, 537–544 - PubMed
    1. Agarwal N., Lamichhane G., Gupta R., Nolan S., Bishai W. R. (2009) Nature 460, 98–102 - PubMed

Publication types

MeSH terms