. 2010 Feb 19;285(8):5815-26.
doi: 10.1074/jbc.M109.071886. Epub 2009 Dec 22.

Activation of the Ran GTPase is subject to growth factor regulation and can give rise to cellular transformation

Affiliations

Activation of the Ran GTPase is subject to growth factor regulation and can give rise to cellular transformation

Thi K Ly et al. J Biol Chem. .

Abstract

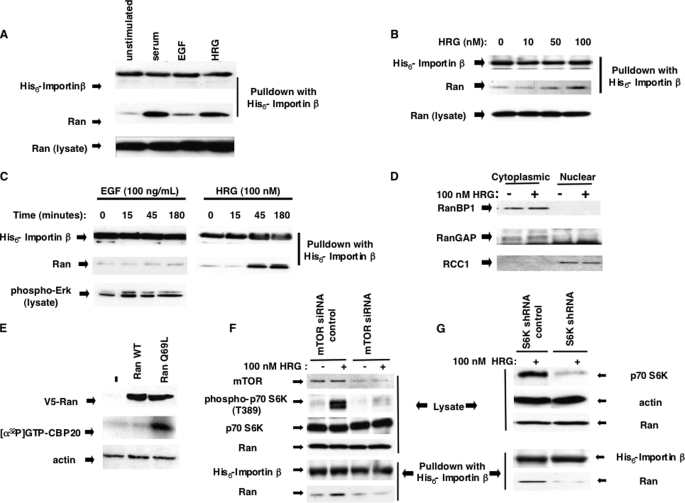
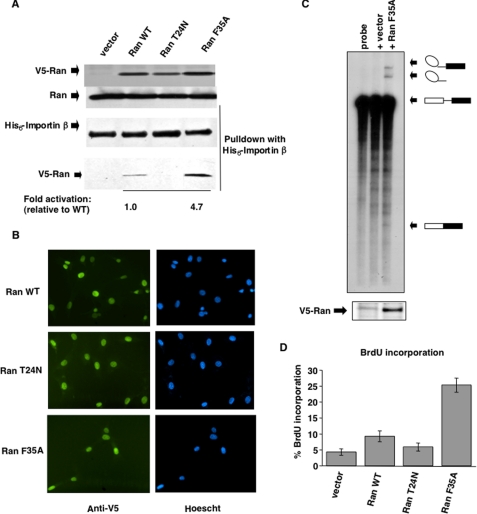
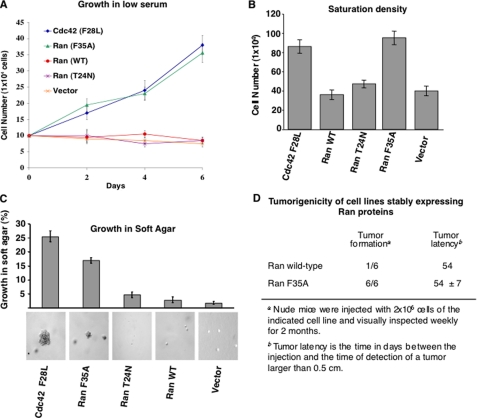
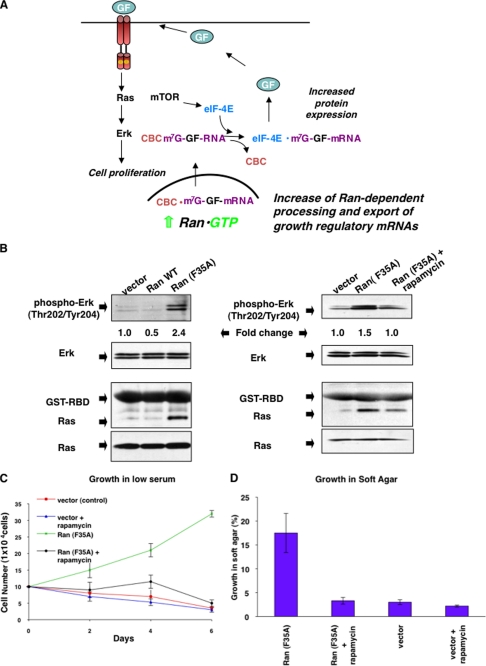
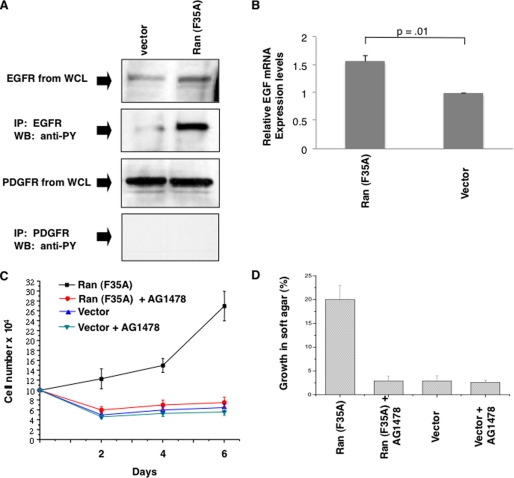
Although the small GTPase Ran is best known for its roles in nucleocytoplasmic transport, mitotic spindle assembly, and nuclear envelope formation, recent studies have demonstrated the overexpression of Ran in multiple tumor types and that its expression is correlated with a poor patient prognosis, providing evidence for the importance of this GTPase in cell growth regulation. Here we show that Ran is subject to growth factor regulation by demonstrating that it is activated in a serum-dependent manner in human breast cancer cells and, in particular, in response to heregulin, a growth factor that activates the Neu/ErbB2 tyrosine kinase. The heregulin-dependent activation of Ran requires mTOR (mammalian target of rapamycin) and stimulates the capped RNA binding capability of the cap-binding complex in the nucleus, thus influencing gene expression at the level of mRNA processing. We further demonstrate that the excessive activation of Ran has important consequences for cell growth by showing that a novel, activated Ran mutant is sufficient to transform NIH-3T3 cells in an mTOR- and epidermal growth factor receptor-dependent manner and that Ran-transformed cells form tumors in mice.


Figures

FIGURE 1.
FIGURE 1.
Characterization of the stimulus-induced Ran activation. A, nuclear cell lysates were prepared from SKBR3 cells that were starved for 5 days in serum-free medium (lane 1) and subsequently stimulated in serum-free medium supplemented with either 20% serum (lane 2), 100 ng/ml EGF (lane 3) or 100 nm HRG (lane 4) for 24 h. Ran-GTP was assayed in a pulldown experiment with His6-importin-β and analyzed by immunoblotting with anti-His6 antibody (top panel) or anti-Ran antibody (middle panel) as indicated. The bottom panel indicates the relative levels of Ran present in the lysates. B, heregulin activates the Ran GTPase in a dose-dependent manner. SKBR3 cells were serum-starved and then stimulated for 24 h with different concentrations of HRG. The cells were then harvested, and nuclear lysates were assayed for Ran-GTP levels using the His6-importin-α pulldown assay (middle panel). His6-importin-β levels and endogenous Ran levels are shown in the top and bottom panels, respectively. C, a time course for Ran activation in response to either 100 ng/ml EGF or 100 nm HRG was performed using serum-starved SKBR3 cells. The cells were harvested after 15, 45, and 180 min of treatment, and nuclear lysates were generated and assayed for Ran-GTP using the His6-importin-β pulldown assay. Ran-GTP precipitated by His6-importin-β was identified by immunoblot analysis (middle panel), as was the level of His6-importin-β present on the beads (top panel). The efficacy of the EGF treatment was determined by detecting cytosolic levels of phospho-ERK by Western blotting (bottom left panel). D, the cellular localization of Ran regulators in response to HRG treatment was assessed by probing cytoplasmic and nuclear lysates for protein levels of RanBP1 (top panel), RanGAP (middle panel), and RCC1 (bottom panel). E, activation of the CBC by Ran-GTP. SKBR3 cells were transiently transfected with V5-RanWT (wild type) or V5-Ran (Q69L) for 24 h, followed by serum starvation for 5 days. The cells were lysed, and nuclear lysates were assayed for the incorporation of [α-32P]GTP into the cap-binding site on CBP20 (middle panel). The lysates were analyzed for expression of the transfected proteins by Western blotting using an anti-V5 antibody (top panel), and an anti-actin antibody was used to ensure equal protein loading (bottom panel). F, knocking down mTOR blocks HRG signaling to Ran. SKBR3 cells were transfected with mTOR siRNA or control siRNA, serum-starved for 5 days, and stimulated with HRG (100 nm) for 1 h at 37 °C. The cytoplasmic lysates were probed with anti-mTOR, (top panel), anti-phospho-p70 S6K (Thr389) (second panel), and anti-p70 S6K (third panel). The nuclear lysates were assayed for Ran-GTP levels using the His6-importin-β pulldown assay (bottom two panels). The nuclear levels of Ran are shown in the fourth panel from the top. G, knocking down p70 S6K blocks HRG signaling to Ran. SKBR3 cells were transiently transfected with a specific p70 S6K shRNA or a control shRNA and then the cells were treated as in F. The knockdown efficiency was determined using an anti-p70 S6K antibody to probe cytoplasmic lysates (top panel), and equal loading was confirmed by probing with an anti-actin antibody (second panel). Nuclear lysates were used to determine Ran protein levels (third panel) and to assess Ran-GTP levels (bottom two panels).
FIGURE 2.
FIGURE 2.
Characterization of NIH-3T3 cells stably expressing Ran (F35A). A, stable NIH-3T3 cell lines were generated with V5-tagged versions of WT Ran, Ran (T24N), Ran (F35A), or a vector control. Expression levels of the exogenous proteins were detected using an anti-V5 antibody (top panel), and endogenous Ran was detected using an anti-Ran antibody (second panel). The activation states of the ectopically expressed proteins were determined by using the His6-importin-β pulldown assay and immunoblotting with the anti-V5 antibody (bottom panel). The relative amount of V5-tagged Ran precipitating with His6-importin-β was measured using the National Institutes of Health Image J software. B, cellular localization of V5-fused WT Ran, Ran (T24N), and Ran (F35A) was determined by immunofluorescence using an anti-V5 antibody, and the nuclei were stained with Hoescht dye. C, NIH-3T3 cells stably transfected with Ran (F35A) or vector alone were analyzed for their ability to support the splicing of a specific m7GpppG-capped pre-mRNA probe (upper panel). The mature splice products and intermediates of the splicing reaction are indicated diagrammatically on the right. The lower panel shows the expression of the Ran (F35A) mutant as determined by Western blotting using an anti-V5 antibody. D, BrdUrd incorporation assays were performed on NIH-3T3 cells stably expressing various Ran constructs. The histograms represent the percentages of cells in each experiment incorporating BrdUrd after 10 h of growth. The data are presented as the means ± standard deviation.
FIGURE 3.
FIGURE 3.
Growth properties of NIH-3T3 cells stably expressing Ran (F35A). A, fibroblasts stably expressing Cdc42 (F28L) and Ran (F35A) show diminished serum dependence for growth. The indicated cell lines were cultured in DMEM supplemented with 0.5% serum, and at the indicated times, the cells were trypsinized and counted. The data are representative of three experiments. B, fibroblasts stably expressing Ran (F35A) and Cdc42 (F28L) exhibit diminished contact inhibition. Control (vector) NIH-3T3 cells and NIH-3T3 cells stably expressing either Cdc42 (F28L), WT Ran, Ran (T24N), and Ran (F35A) were cultured in DMEM supplemented with 5% calf serum for 6 days, trypsinized, and counted. The data represent the average of three independent experiments. C, fibroblasts stably expressing Ran (F35A) and Cdc42 (F28L) exhibit anchorage-independent growth. NIH-3T3 cells that stably express vector control, WT Ran, Ran (T24N), Cdc42 (F28L), and Ran (F35A) were mixed with medium supplemented with 0.3% agar and 10% calf serum and plated on top of a 0.5% agarose layer. Growing colonies were scored after 14 days for the various cell lines. The values shown are the averages of three independent experiments. The bottom panels are photomicrographs of colony formation of the cell lines in soft agar (40× magnification). D, NIH-3T3 cells stably expressing wild type Ran and Ran (F35A) were injected into the right and left flank of nude mice. Two months after injection, the mice were euthanized, and the tumors were excised. The data are representative of two independent experiments.
FIGURE 4.
FIGURE 4.
Activation of mitogenic signaling proteins by the stable expression of Ran (F35A). A, model for a mechanism by which Ran (F35A) transforms cells. Increased levels of Ran-GTP in the nucleus (i.e. because of the expression of the Ran (F35A) mutant) leads to increased binding of transcripts encoding growth regulatory proteins (i.e. a growth factor (GF)) to the CBC and ultimately enhanced translation by eIF-4E. The synthesis and secretion of growth factors then result in the activation of the Ras-ERK signaling pathway giving rise to excessive mitogenic signaling. B, stable cell lines expressing WT Ran, Ran (F35A), and a vector control were cultured and serum-starved for 24 h with DMEM supplemented with 0.5% calf serum. Left-hand panels, the lysates were analyzed for the activation of ERK using antibodies against phospho-ERK (Thr202/Tyr204) (top panel) and Ras using the Ras activation assay (third panel from the top). Fold change in ERK activation was quantified with the NIH Image J software and is stated relative to ERK activation in the vector control lane. Total ERK and Ras in the lysates are shown in the second panels from the top and the bottom panels, respectively. Right-hand panels, conditions were identical to those in the left-hand panels except that in some cases rapamycin (50 ng/ml) was added 30 min prior to harvesting the indicated cell lines. C, reversal of Ran transformation by rapamycin. Vector control cells or cells stably expressing Ran (F35A) were grown in 0.5% calf serum, with or without rapamycin (100 nm) every 2 days. The data shown represent the average of three independent experiments. D, the ability of Ran (F35A)-expressing cells and vector control cells to grow in soft agar in the presence of rapamycin was assessed by adding rapamycin (100 nm) every 3 days to the conditions described in Fig. 3C. The results represent an average of three experiments.
FIGURE 5.
FIGURE 5.
Ran (F35A)-induced transformation requires EGF signaling. A, activation of the EGFR in Ran (F35A) cells. NIH-3T3 cells expressing either vector or Ran (F35A) were serum-starved for 48 h and then harvested. Relative EGFR levels were assessed by probing whole cell lysates with anti-EGFR (top panel). EGFR was also immunoprecipitated (IP) from whole cell lysates and analyzed for activation by probing with an anti-phosphotyrosine antibody (second panel). Relative PDGFR levels were determined by probing whole cell lysates with an anti-PDGFR antibody (third panel), and their activation state was determined by immunoprecipitating PDGFRs from whole cell lysates and then probing with an anti-phosphotyrosine antibody (bottom panel). B, the expression levels of EGF mRNA from NIH-3T3 cells expressing either Ran (F35A) or vector alone were determined using quantitative PCR. The results shown are the averages of three independent experiments with standard deviation. The data were further analyzed using Student's t test. C, vector control and Ran (F35A)-expressing cells were grown in low serum with and without the addition of AG1478 (3 μm) every 2 days. The data shown are representative of three independent experiments. D, the effect of AG1478 on the ability of vector control or Ran (F35A)-expressing cells to grow in soft agar was assessed by adding AG1478 (3 μm) to the soft agar growth conditions every 3 days. The values that are shown are the averages of three independent experiments. WB, Western blot.

Similar articles

Cited by

References

    1. Macara I. G. (2001) Microbiol. Mol. Biol. Rev. 65, 570–594 - PMC - PubMed
    1. Stewart M. (2007) Nat. Rev. Mol. Cell Biol. 8, 195–208 - PubMed
    1. Görlich D., Kraft R., Kostka S., Vogel F., Hartmann E., Laskey R. A., Mattaj I. W., Izaurralde E. (1996) Cell 87, 21–32 - PubMed
    1. Izaurralde E., Lewis J., McGuigan C., Jankowska M., Darzynkiewicz E., Mattaj I. W. (1994) Cell 78, 657–668 - PubMed
    1. Izaurralde E., Stepinski J., Darzynkiewicz E., Mattaj I. W. (1992) J. Cell Biol. 118, 1287–1295 - PMC - PubMed

Publication types

MeSH terms