. 2010 Feb 19;285(8):5488-96.
doi: 10.1074/jbc.M109.058024. Epub 2009 Dec 22.

Ran overexpression leads to diminished T cell responses and selectively modulates nuclear levels of c-Jun and c-Fos

Affiliations

Ran overexpression leads to diminished T cell responses and selectively modulates nuclear levels of c-Jun and c-Fos

Xiaoying Qiao et al. J Biol Chem. .

Abstract

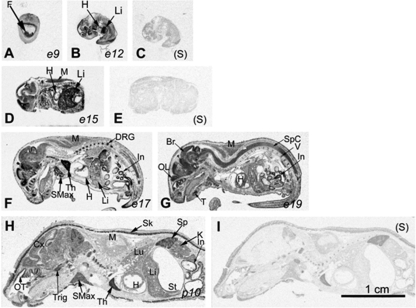
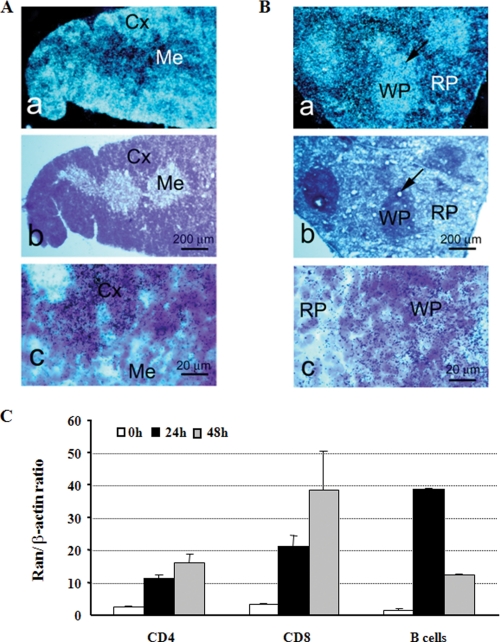
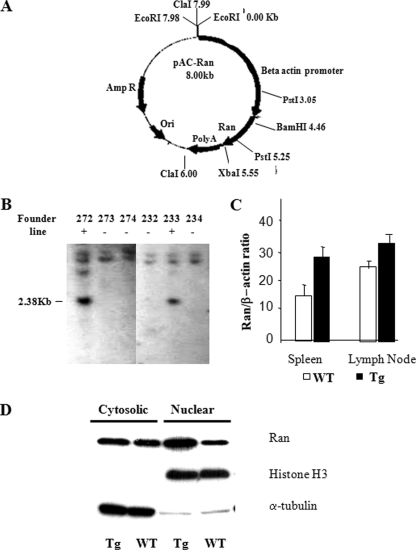
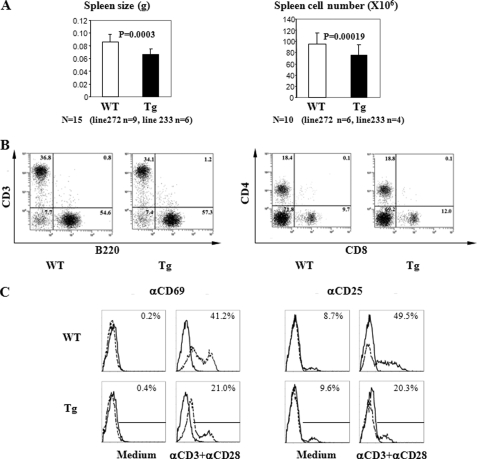
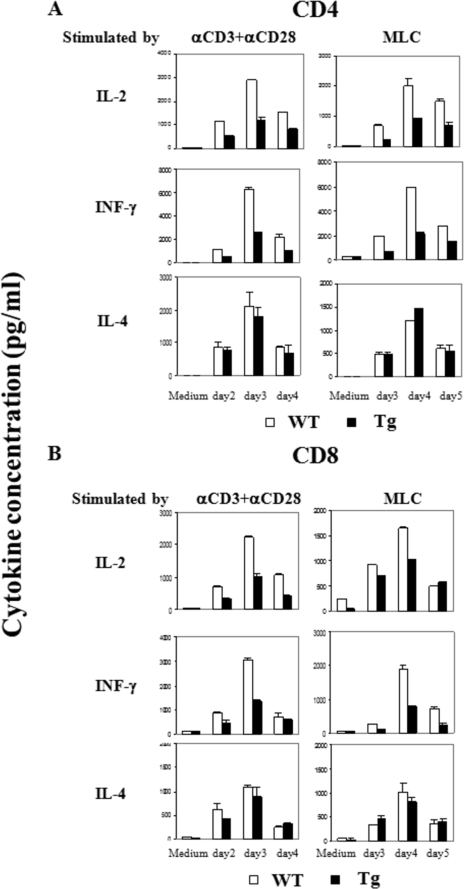
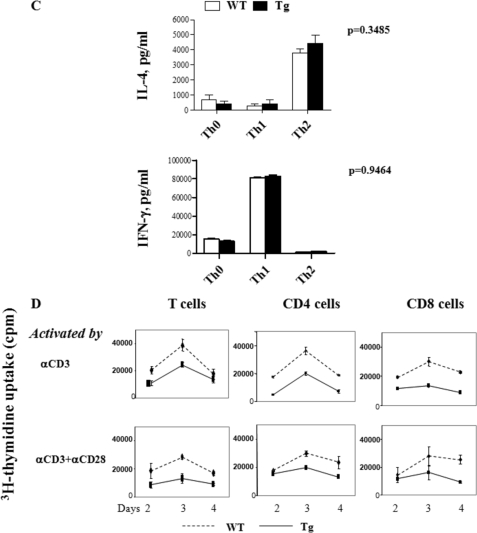
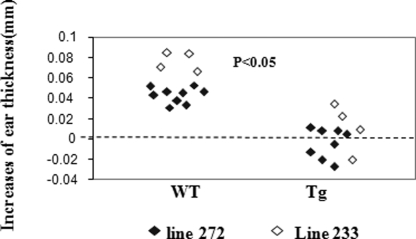
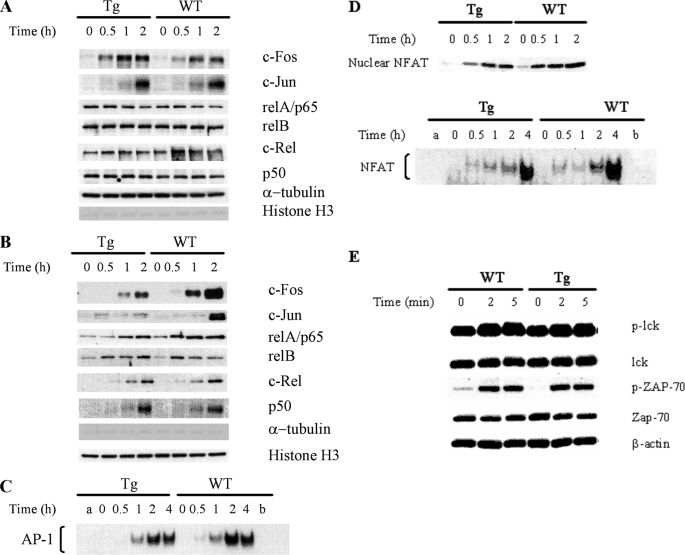
Ras-related nuclear protein (Ran) is a Ras family GTPase, and its documented functions are the regulation of DNA replication, cell cycle progression, nuclear structure formation, RNA processing and exportation, and nuclear protein importation. In this study, we performed detailed mapping of Ran expression during mouse ontogeny using in situ hybridization. High Ran expression was found in various organs and tissues including the thymus cortex and spleen white pulp. Ran was induced in T cells 24 h after their activation. The function of Ran in the immune system was investigated using Ran transgenic (Tg) mice. In Ran Tg T cells, there was compromised activation marker expression, lymphokine secretion, and proliferation upon T cell receptor activation in vitro when compared with wild type T cells. Tg mice also manifested defective delayed type hypersensitivity in vivo. Upon PMA and ionomycin stimulation, Tg T cells were defective in nuclear accumulation of AP-1 factors (c-Jun and c-Fos) but not NF-kappaB family members. Our experiments showed that Ran had important regulatory function in T cell activation. One of the possible mechanisms is that intracellular Ran protein levels control the nuclear retention for selective transcription factors such as c-Jun and c-Fos of AP-1, which is known to be critical in T cell activation and proliferation and lymphokine secretion.


Figures

FIGURE 1.
FIGURE 1.
Ran expression during ontogeny according to in situ hybridization. X-ray autoradiography (bright field) of Ran in situ hybridization in mice from e9 to p10, as indicated, is shown in panels A, B, D, F, G, and H. Hybridization with the sense probe (S) is presented as controls in panels C, E, and I. The abbreviations are as follows: Br, brain; Cx, cerebral cortex; DRG, dorsal root ganglion; F, fetus; H, heart; In, intestines; K, kidney; Li, liver; Lu, lung; M, muscles; OL, olfactory lobe; OT, olfactory turbinates; T, teeth; Th, thymus; Sk, skin; SMax, submaxillary gland; Sp, spleen; Spc, spinal cord; St, stomach; Trig, trigeminal ganglion; V, vertebrae. Bar = 1 cm.
FIGURE 2.
FIGURE 2.
Ran expression in lymphoid organs and cells. A and B, in situ hybridization of the thymus and spleen with antisense Ran probes. Panel a, dark field x-ray autoradiography; panel b, consecutive sections stained by hematoxylin; panel c, bright field emulsion autoradiography with hematoxylin counter staining. Cx, cortex; Me, medulla; WP, white pulp (indicated by arrows); RP, red pulp. C, real-time RT-PCR of Ran expression in lymphocytes. CD4 and CD8 cells were stimulated by solid phase anti-CD3 (0.57 μg/ml; concentration for coating the wells) plus anti-CD28 (2.86 μg/ml; concentration for coating the wells). B cells were stimulated by soluble anti-CD40 (0.1 μg/ml) plus IL-4 (10 ng/ml). The cells were harvested at 24 and 48 h, and total RNA was extracted for real-time RT-PCR, which was carried out in triplicate. Means ± S.D. of Ran versus β-actin signal ratios are shown. Data are representative of three similar experiments.
FIGURE 3.
FIGURE 3.
Generation and characterization of Ran Tg mice. A, pAC-Ran construct for Ran Tg mice generation. The 4.9Kb ClaI/ClaI fragment was used for microinjection. B, Southern blot genotyping of Ran founder tail DNA. The 2.38-kb band specific to the Ran transgene is indicated. C, real-time RT-PCR of Ran mRNA from spleen and lymph node cells. Mean ± S.D. of ratios of Ran versus β-actin signals are shown. Samples are in triplicate. D, Ran overexpression in Tg T cells according to immunoblotting. Cytosolic and nuclear proteins were fractionated from Tg and WT T cells and were analyzed for Ran protein expression using immunoblotting (20 μg/lane). The cytosolic and nuclear protein purity was verified by α-tubulin and histone H3 levels.
FIGURE 4.
FIGURE 4.
Spleen size and cellularity as well as spleen cell subpopulation and expression of their activation marker in Ran Tg mice. A, reduced spleen weight and cellularity in Ran Tg mice. Fifteen pairs of Tg mice and their WT littermates (nine pairs from line 272 and six pairs from line 233) were compared for their spleen weight, and 10 pairs (six pairs from line 272 and four pairs from line 233) were compared for their spleen cellularity. The difference was highly significant (p < 0.001, paired Student's t test) for both parameters. Error bars indicate ± S.D. B, spleen cell subpopulations of Ran Tg mice. The T cell (CD3+) and B cell (B220+) populations and CD4+ and CD8+ T cell populations in the spleens of Ran Tg mice (line 272) and their WT littermates were analyzed by two-color flow cytometry. The percentages are indicated in the histogram. C, C69 and CD25 expression on activated Ran Tg T cells. Ran Tg or WT T cells were stimulated overnight by solid phase anti-CD3 (4 μg/ml, concentration used during coating). The CD69+ or CD25+ expression on gated T cells (Thy1.2+) was measured by two-color flow cytometry (CD69/Thy1.2 and CD25/Thy1.2). The experiments described in panels B and C were repeated more than three times, and representative data are shown.
FIGURE 5.
FIGURE 5.
Lymphokine production and proliferation of Ran Tg T cell. A and B, lymphokine secretion by CD4 and CD8 cells. Spleen CD4 (panel A) or CD8 (panel B) T cells from Ran Tg mice or WT littermates were stimulated by the following reagents or cells: solid phase anti-CD3 (0.57 μg/ml) plus anti-CD28 (2.86 μg/ml) (concentrations used during plate coating); mitomycin C-treated allogeneic BALB/c spleen cells in mixed lymphocyte culture (MLC); no stimulation (Medium). Supernatants were harvested on the days as indicated and assayed in duplicate for lymphokines by enzyme-linked immunosorbent assay. C, cytokine secretion by Th1 and Th2 cells. Naive CD4 cells (Th0) were driven into Th1 and Th2 cells under their respective culture conditions. The cells were stimulated overnight with 5 nm PMA and 500 ng/ml ionomycin, and the supernatants were then collected for cytokine analysis. D, proliferation of Ran Tg and WT total T cells, CD4 cells, or CD8 cells. The cells were stimulated by solid phase anti-CD3 (4 μg/ml) (concentration used during plate coating) or solid phase anti-CD3 (0.57 μg/ml) plus anti-CD28 (2.86 μg/ml). The cells were pulsed for 16 h with [3H]thymidine before harvest, and their [3H]thymidine uptake was measured on days 2, 3, and 4. The experiments were repeated more than three times, and representative data with means ± S.D. are shown.
FIGURE 5.
FIGURE 5.
Lymphokine production and proliferation of Ran Tg T cell. A and B, lymphokine secretion by CD4 and CD8 cells. Spleen CD4 (panel A) or CD8 (panel B) T cells from Ran Tg mice or WT littermates were stimulated by the following reagents or cells: solid phase anti-CD3 (0.57 μg/ml) plus anti-CD28 (2.86 μg/ml) (concentrations used during plate coating); mitomycin C-treated allogeneic BALB/c spleen cells in mixed lymphocyte culture (MLC); no stimulation (Medium). Supernatants were harvested on the days as indicated and assayed in duplicate for lymphokines by enzyme-linked immunosorbent assay. C, cytokine secretion by Th1 and Th2 cells. Naive CD4 cells (Th0) were driven into Th1 and Th2 cells under their respective culture conditions. The cells were stimulated overnight with 5 nm PMA and 500 ng/ml ionomycin, and the supernatants were then collected for cytokine analysis. D, proliferation of Ran Tg and WT total T cells, CD4 cells, or CD8 cells. The cells were stimulated by solid phase anti-CD3 (4 μg/ml) (concentration used during plate coating) or solid phase anti-CD3 (0.57 μg/ml) plus anti-CD28 (2.86 μg/ml). The cells were pulsed for 16 h with [3H]thymidine before harvest, and their [3H]thymidine uptake was measured on days 2, 3, and 4. The experiments were repeated more than three times, and representative data with means ± S.D. are shown.
FIGURE 6.
FIGURE 6.
Reduced delayed type hypersensitivity against fluorescein isothiocyanate in vivo in Ran Tg mice. Delayed type hypersensitivity of Ran Tg mice (total n = 11; n = 8 for line 272, and n = 4 for line 233) and their WT littermates (total n = 13; n = 9 for line 272, and n = 4 for line 233) was determined by measuring ear thickness before and 24 h after ear painting. The increase in ear thickness of each mouse is presented. The difference between the two groups is statistically significant (p < 0.05, two-tailed Student's t test).
FIGURE 7.
FIGURE 7.
AP-1 and NF-κB protein nuclear import in T cells according to immunoblotting and EMSA. WT and Tg spleen T cells were stimulated with PMA (5 nm) and ionomycin PMA (1 μg/ml) at 37 °C for various time periods as indicated. Cytosolic and nuclear proteins were then extracted from the cells. The nuclear and cytosolic fractions were resolved in 10% SDS gels and analyzed by immunoblotting using Abs against AP-1 and NF-κB members. α-Tubulin and histone H3 levels were used to monitor the cross-contamination of cytosolic proteins in the nuclear fraction and vice versa. The nuclear fractions were also employed in AP-1 EMSA. The experiments were performed at least twice, and representative results are shown. A, protein levels of AP-1 and NF-κB members in the cytosol of Tg and WT T cells remain constant during PMA and ionomycin stimulation according to immunoblotting. B, compromised AP-1 but not NF-κB members nuclear import in Tg T cells upon PMA and ionomycin stimulation according to immunoblotting. C, compromised AP-1 nuclear import in Tg T cells upon PMA and ionomycin stimulation according to EMSA. Nuclear protein extracted from PMA plus ionomycin-stimulated WT and Tg T cells were employed in AP-1 EMSA. Lane a is a control with no nuclear protein added. Competition was performed by incubating extracts with a 100-fold molar excess of unlabeled oligonucleotide before the addition of labeled probe (lane b). Data are representative of at least three independent experiments. D, moderately compromised NFAT nuclear import in Tg T cells. Nuclear protein extracted from PMA plus ionomycin-stimulated WT and Tg T cells were employed in NFAT EMSA. Lane a is a control with no nuclear protein added. Competition was performed by incubating extracts with a 100-fold molar excess of unlabeled oligonucleotide before the addition of labeled probe (lane b). Data are representative of at least three independent experiments. E, normal early TCR signaling in Ran Tg T cells. Ran Tg CD4 T cells were cross-linked by anti-CD3 and anti-CD4 for 0–5 min, and their Lck and ZAP-70 phosphorylation (indicated by p-Lck and p-ZAP-70) in total cell lysates was assessed by immunoblotting. Total Lck, ZAP-70, and β-actin were used to ascertain even protein loading.

Similar articles

Cited by

References

    1. Drivas G. T., Shih A., Coutavas E., Rush M. G., D'Eustachio P. (1990) Mol. Cell. Biol. 10, 1793–1798 - PMC - PubMed
    1. Ren M., Drivas G., D'Eustachio P., Rush M. G. (1993) J. Cell Biol. 120, 313–323 - PMC - PubMed
    1. Belhumeur P., Lee A., Tam R., DiPaolo T., Fortin N., Clark M. W. (1993) Mol. Cell. Biol. 13, 2152–2161 - PMC - PubMed
    1. Bischoff F. R., Ponstingl H. (1991) Nature 354, 80–82 - PubMed
    1. Matsumoto T., Beach D. (1993) Mol. Biol. Cell. 4, 337–345 - PMC - PubMed

Publication types

MeSH terms

LinkOut - more resources