

Mislocalization of SLP-76 leads to aberrant inflammatory cytokine and autoantibody production
- PMID: 20029045
- PMCID: PMC2920203
- DOI: 10.1182/blood-2009-08-237438
Mislocalization of SLP-76 leads to aberrant inflammatory cytokine and autoantibody production
Abstract
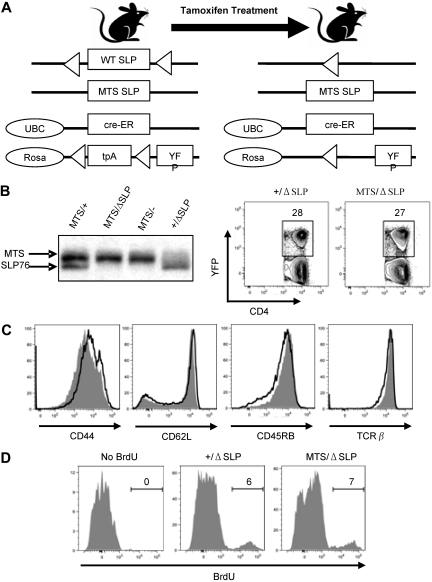
Central and peripheral tolerance is required to prevent immune responses to self-antigens. We now present a mouse model in which wild-type (WT) SH2 domain-containing leukocyte phosphoprotein of 76 kDa (SLP-76) has been constitutively targeted to the membrane, where CD4+ T cells become spontaneously dysregulated and develop an inflammatory phenotype. Mice bearing membrane-targeted SLP-76 (MTS) have a partial T-cell lymphopenia and impaired signaling though the mature T-cell receptor. The CD4+ T cells that develop in these mice possess an activated-like phenotype and are skewed toward the inflammatory T(H)1 and T(H)17 lineages. MTS mice also spontaneously develop autoantibodies at an early age. To rule out abnormal thymic selection as the sole cause of the MTS phenotype, we expressed WT SLP-76 along with the MTS followed by deletion of the WT allele in peripheral T cells. The peripheral MTS-expressing T cells demonstrate skewed cytokine responses when transferred into lymphopenic hosts. Thus, the abnormal effector T-cell phenotype still occurs in the presence of preserved central and peripheral tolerance, suggesting that diminished T-cell receptor signaling can promote skewed T-cell responses.
Figures

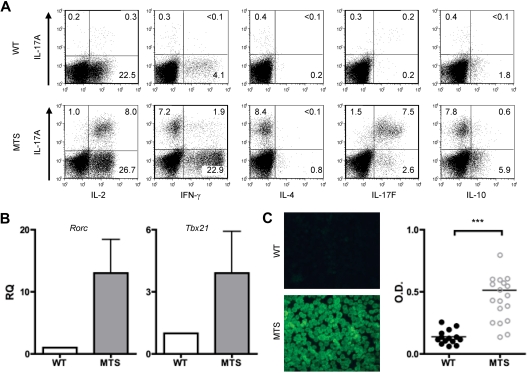
 ) mice were analyzed for the presence of anti-dsDNA antibodies and antinuclear antibodies (IgG). Horizontal lines represent averages. Significance was determined using the Mann-Whitney test. ***P < .001. Images were obtained with a Nikon Eclipse E600 microscope (40× objective and 1:40 serum dilution) and captured with a Nikon DXM 1200 camera. Images were processed with IP Labs Scientific Image Processing (Scanalytics Inc).


Similar articles
-
A mutation within the SH2 domain of slp-76 regulates the tissue distribution and cytokine production of iNKT cells in mice.Eur J Immunol. 2016 Sep;46(9):2121-36. doi: 10.1002/eji.201646331. Epub 2016 Jul 29. Eur J Immunol. 2016. PMID: 27349342
-
Impaired thymic selection in mice expressing altered levels of the SLP-76 adaptor protein.J Leukoc Biol. 2008 Feb;83(2):419-29. doi: 10.1189/jlb.0507297. Epub 2007 Oct 26. J Leukoc Biol. 2008. PMID: 17965338
-
Conditional deletion reveals a cell-autonomous requirement of SLP-76 for thymocyte selection.J Exp Med. 2005 Oct 3;202(7):893-900. doi: 10.1084/jem.20051128. Epub 2005 Sep 26. J Exp Med. 2005. PMID: 16186188 Free PMC article.
-
The Role of Adaptor Proteins in the Biology of Natural Killer T (NKT) Cells.Front Immunol. 2019 Jun 25;10:1449. doi: 10.3389/fimmu.2019.01449. eCollection 2019. Front Immunol. 2019. PMID: 31293596 Free PMC article. Review.
-
Thymic commitment of regulatory T cells is a pathway of TCR-dependent selection that isolates repertoires undergoing positive or negative selection.Curr Top Microbiol Immunol. 2005;293:43-71. doi: 10.1007/3-540-27702-1_3. Curr Top Microbiol Immunol. 2005. PMID: 15981475 Review.
Cited by
-
Understanding signal integration through targeted mutations of an adapter protein.FEBS Lett. 2010 Dec 15;584(24):4901-9. doi: 10.1016/j.febslet.2010.10.025. Epub 2010 Oct 21. FEBS Lett. 2010. PMID: 20965179 Free PMC article.
-
Distinct requirements of microRNAs in NK cell activation, survival, and function.J Immunol. 2010 Oct 1;185(7):3835-46. doi: 10.4049/jimmunol.1000980. Epub 2010 Aug 30. J Immunol. 2010. PMID: 20805417 Free PMC article.
-
T-cell receptor signals direct the composition and function of the memory CD8+ T-cell pool.Blood. 2010 Dec 16;116(25):5548-59. doi: 10.1182/blood-2010-06-292748. Epub 2010 Sep 16. Blood. 2010. PMID: 20847203 Free PMC article.
-
Quantitative reduction of the TCR adapter protein SLP-76 unbalances immunity and immune regulation.J Immunol. 2015 Mar 15;194(6):2587-95. doi: 10.4049/jimmunol.1400326. Epub 2015 Feb 6. J Immunol. 2015. PMID: 25662996 Free PMC article.
-
A novel prognostic biomarker LCP2 correlates with metastatic melanoma-infiltrating CD8+ T cells.Sci Rep. 2021 Apr 28;11(1):9164. doi: 10.1038/s41598-021-88676-9. Sci Rep. 2021. PMID: 33911146 Free PMC article.
References
-
- Zhang W, Sloan-Lancaster J, Kitchen J, Trible RP, Samelson LE. LAT: the ZAP-70 tyrosine kinase substrate that links T cell receptor to cellular activation. Cell. 1998;92(1):83–92. - PubMed
-
- Bubeck Wardenburg J, Fu C, Jackman JK, et al. Phosphorylation of SLP-76 by the ZAP-70 protein-tyrosine kinase is required for T-cell receptor function. J Biol Chem. 1996;271(33):19641–19644. - PubMed
-
- Jordan MS, Singer AL, Koretzky GA. Adaptors as central mediators of signal transduction in immune cells. Nat Immunol. 2003;4(2):110–116. - PubMed
-
- Koretzky GA, Abtahian F, Silverman MA. SLP76 and SLP65: complex regulation of signalling in lymphocytes and beyond. Nat Rev Immunol. 2006;6(1):67–78. - PubMed
Publication types
MeSH terms
Substances
Grants and funding
LinkOut - more resources
Full Text Sources
Molecular Biology Databases
Research Materials
