

Alpha-synuclein overexpression in mice alters synaptic communication in the corticostriatal pathway
- PMID: 20029978
- PMCID: PMC3707301
- DOI: 10.1002/jnr.22327
Alpha-synuclein overexpression in mice alters synaptic communication in the corticostriatal pathway
Abstract
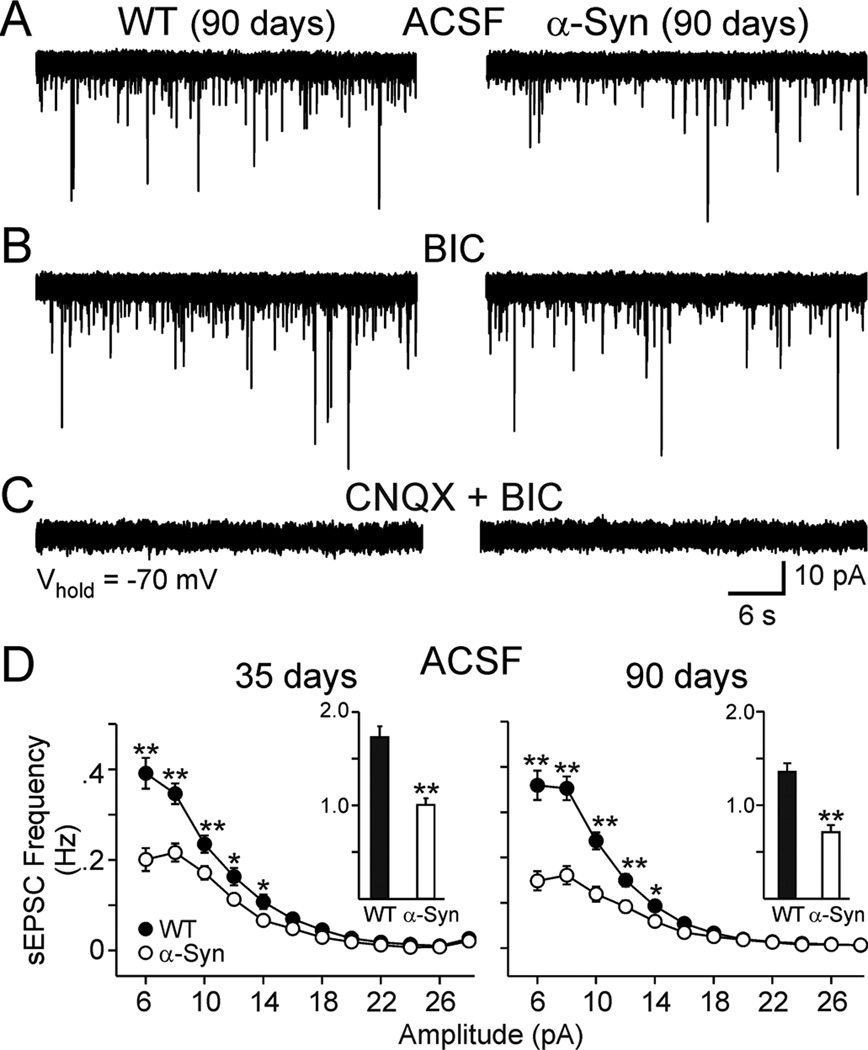
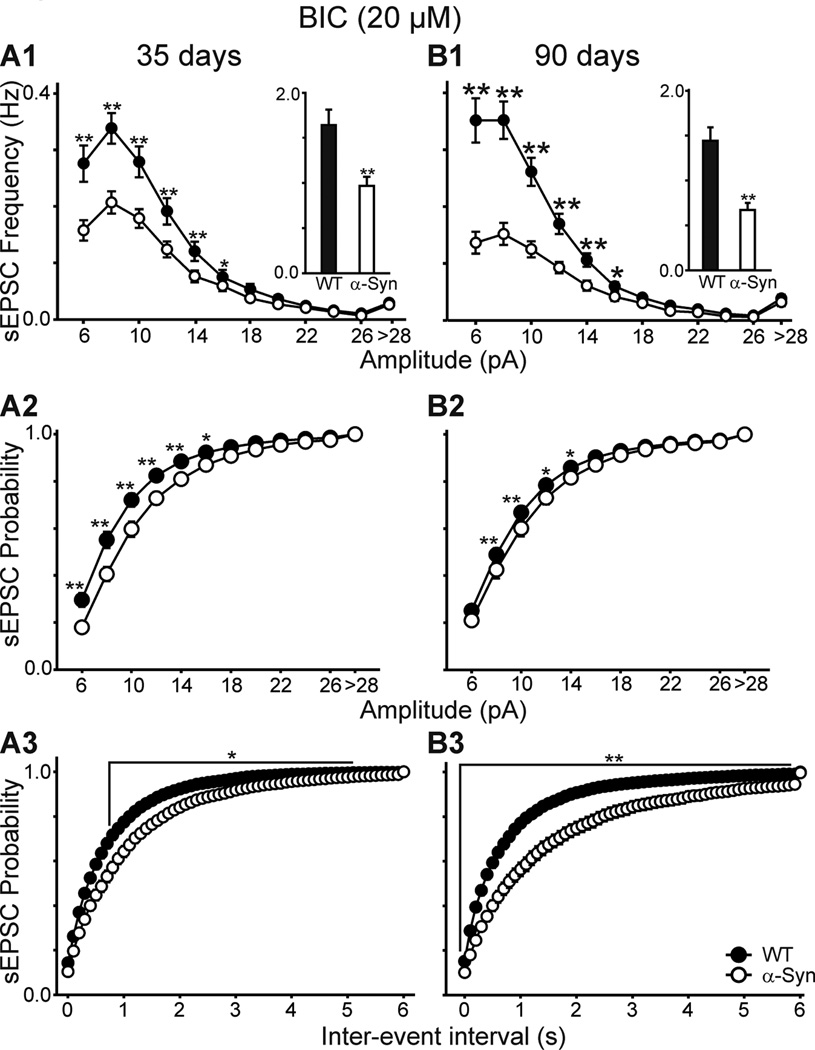
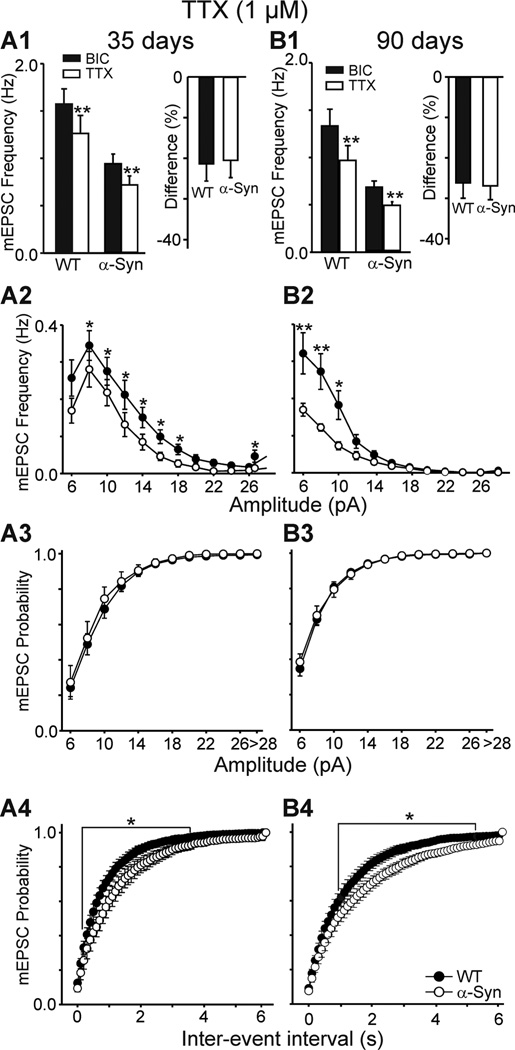
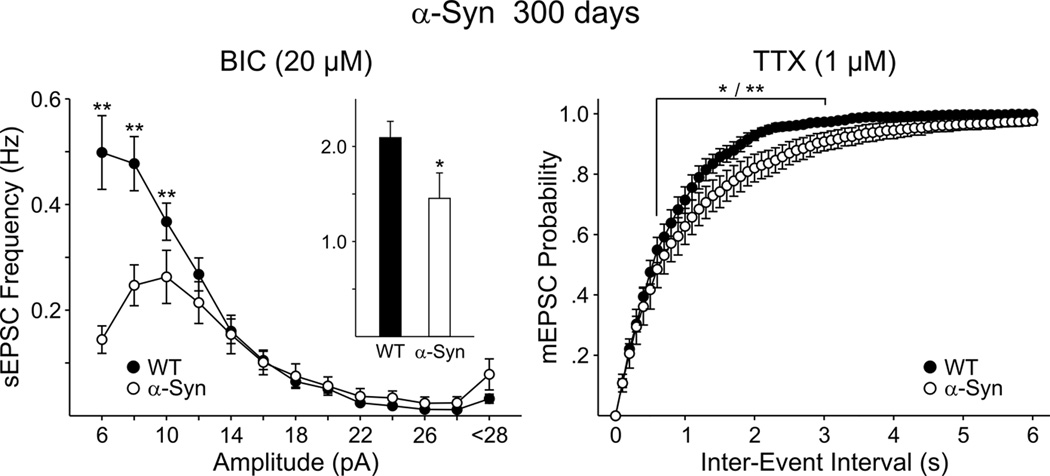
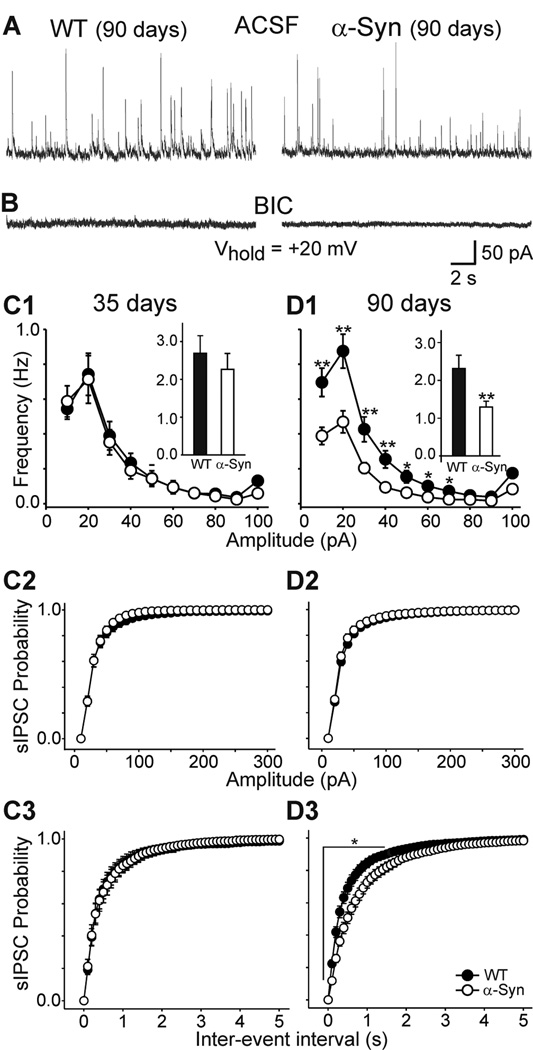
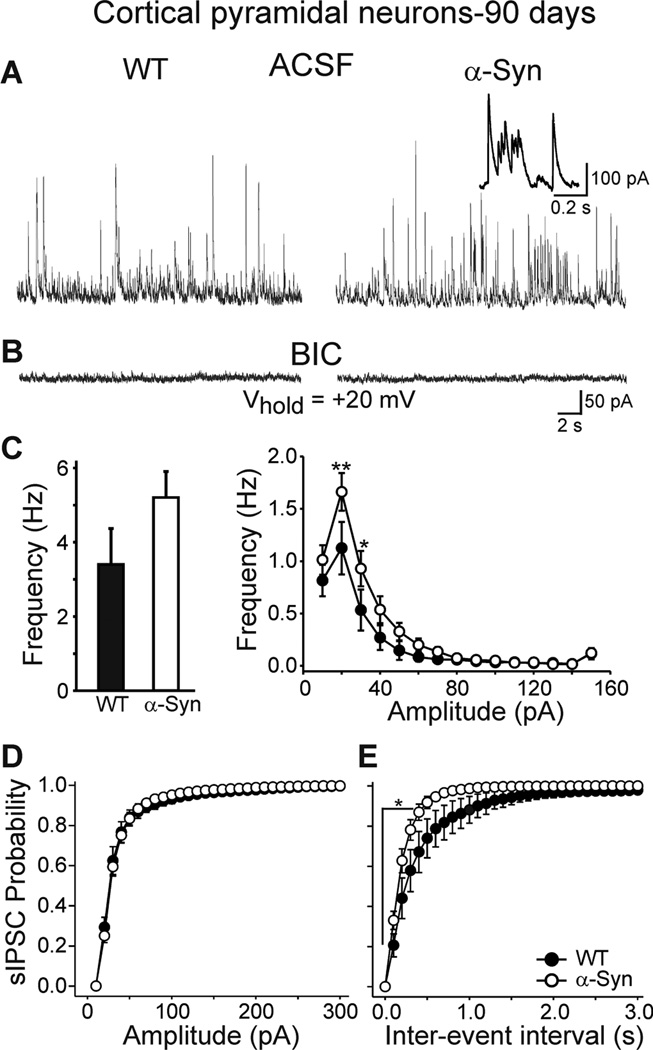
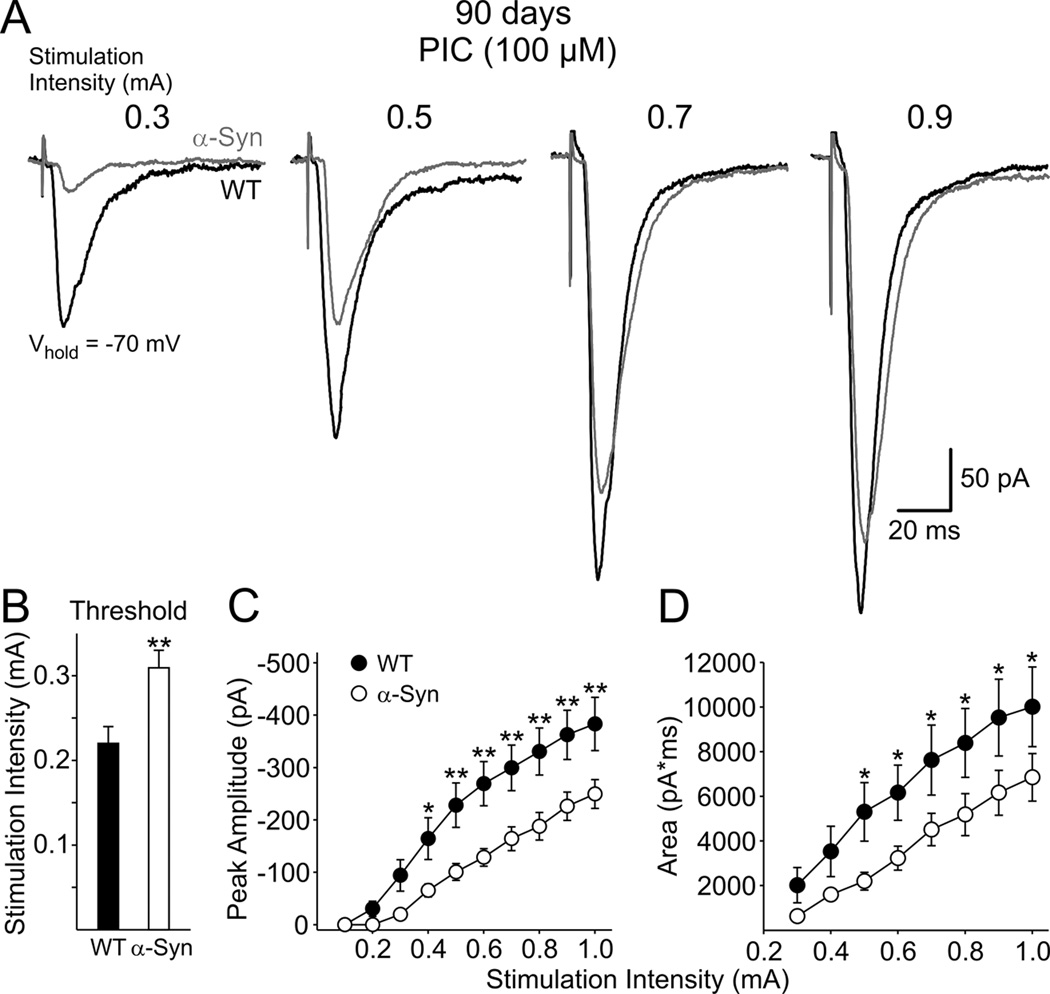
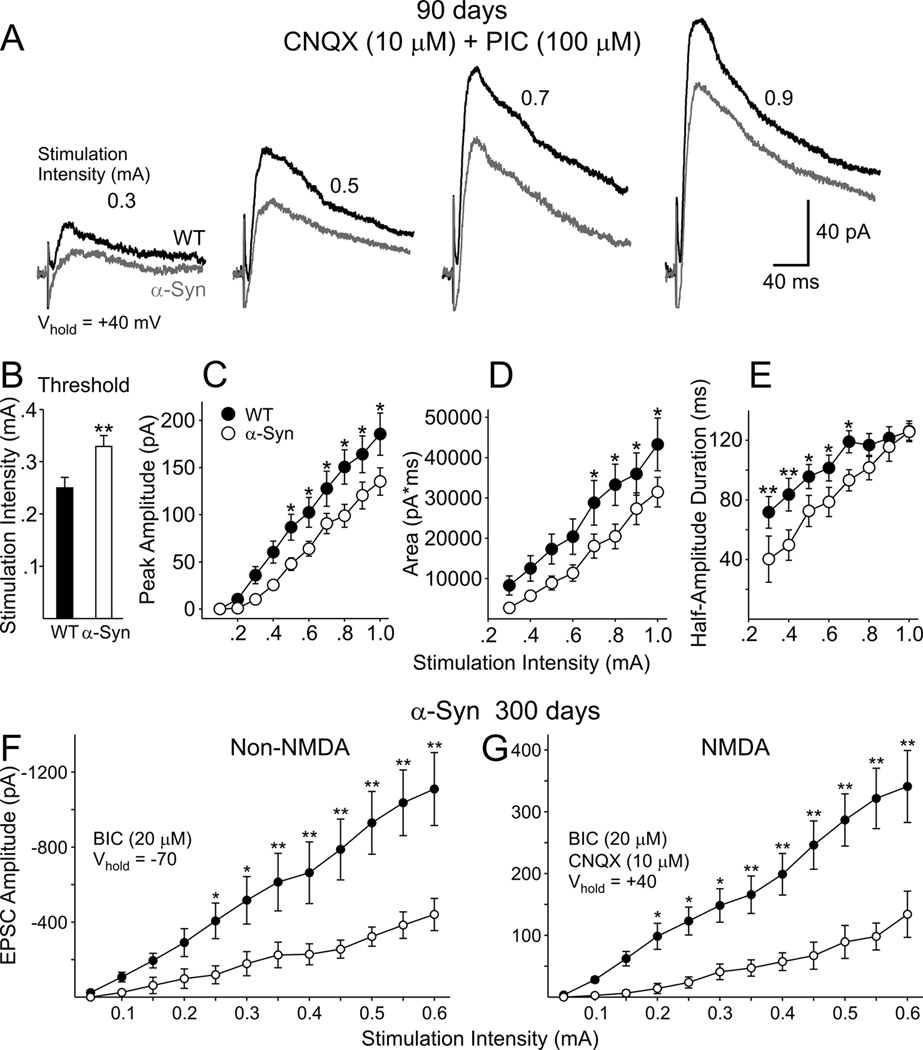
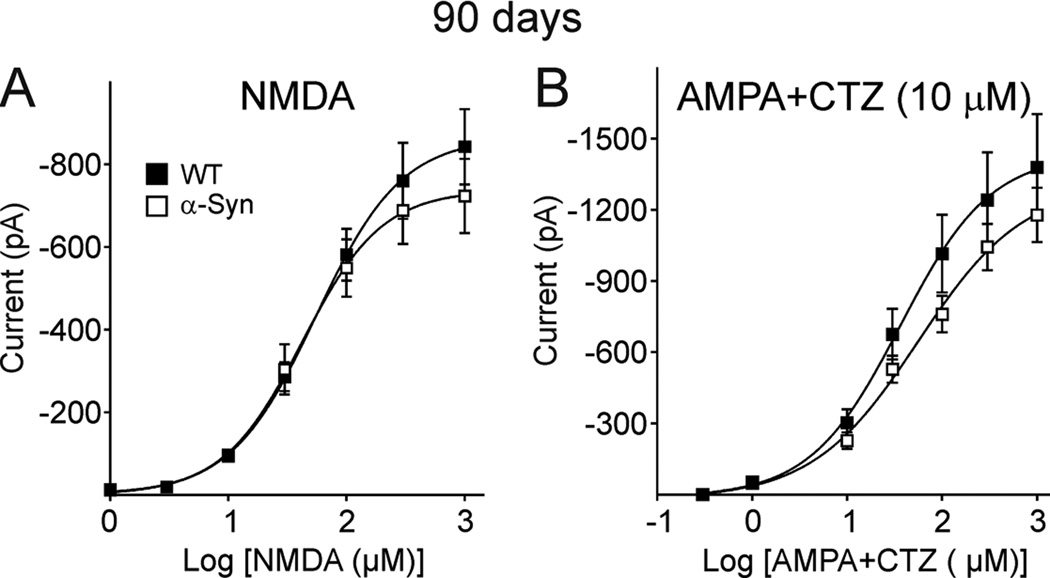
alpha-Synuclein (alpha-Syn) is a presynaptic protein implicated in Parkinson's disease (PD). Mice overexpressing human wildtype (WT) alpha-Syn under the Thy1 promoter show high levels of alpha-Syn in cortical and subcortical regions, exhibit progressive sensorimotor anomalies, as well as non-motor abnormalities and are considered models of pre-manifest PD as there is little evidence of early loss of dopaminergic (DA) neurons. We used whole-cell patch clamp recordings from visually identified striatal medium-sized spiny neurons (MSSNs) in slices from alpha-Syn and WT littermate control mice at 35, 90 and 300 days of age to examine corticostriatal synaptic function. MSSNs displayed significant decreases in the frequency of spontaneous excitatory postsynaptic currents (EPSCs) in alpha-Syn mice at all ages. This difference persisted in the presence of tetrodotoxin, indicating it was independent of action potentials. Stimulation thresholds for evoking EPSCs were significantly higher and responses were smaller in alpha-Syn mice. These data suggest a decrease in neurotransmitter release at the corticostriatal synapse. At 90 days the frequency of spontaneous GABA(A) receptor-mediated synaptic currents was decreased in MSSNs but increased in cortical pyramidal neurons. These observations indicate that high levels of expression of alpha-Syn alter corticostriatal synaptic function early and they provide evidence for early synaptic dysfunction in a pre-manifest model of PD. Of importance, these changes are opposite to those found in DA-depletion models, suggesting that before degeneration of DA neurons in the substantia nigra synaptic adaptations occur at the corticostriatal synapse that may initiate subtle preclinical manifestations.
Figures

Similar articles
-
Functional alterations of the dopaminergic and glutamatergic systems in spontaneous α-synuclein overexpressing rats.Exp Neurol. 2017 Jan;287(Pt 1):21-33. doi: 10.1016/j.expneurol.2016.10.009. Epub 2016 Oct 20. Exp Neurol. 2017. PMID: 27771352
-
Altered corticostriatal neurotransmission and modulation in dopamine transporter knock-down mice.J Neurophysiol. 2007 Jul;98(1):423-32. doi: 10.1152/jn.00971.2006. Epub 2007 May 23. J Neurophysiol. 2007. PMID: 17522168
-
Alterations in corticostriatal synaptic plasticity in mice overexpressing human alpha-synuclein.Neuroscience. 2009 Mar 17;159(2):501-13. doi: 10.1016/j.neuroscience.2009.01.021. Neuroscience. 2009. PMID: 19361478 Free PMC article.
-
Mechanisms of α-Synuclein Induced Synaptopathy in Parkinson's Disease.Front Neurosci. 2018 Feb 19;12:80. doi: 10.3389/fnins.2018.00080. eCollection 2018. Front Neurosci. 2018. PMID: 29515354 Free PMC article. Review.
-
Corticostriatal connectivity and its role in disease.Nat Rev Neurosci. 2013 Apr;14(4):278-91. doi: 10.1038/nrn3469. Nat Rev Neurosci. 2013. PMID: 23511908 Free PMC article. Review.
Cited by
-
Reduced expression of α-synuclein in alcoholic brain: influence of SNCA-Rep1 genotype.Addict Biol. 2014 May;19(3):509-15. doi: 10.1111/j.1369-1600.2012.00495.x. Epub 2012 Sep 13. Addict Biol. 2014. PMID: 22974310 Free PMC article.
-
Impairment of mitochondria in adult mouse brain overexpressing predominantly full-length, N-terminally acetylated human α-synuclein.PLoS One. 2013 May 7;8(5):e63557. doi: 10.1371/journal.pone.0063557. Print 2013. PLoS One. 2013. PMID: 23667637 Free PMC article.
-
Analysis of striatal transcriptome in mice overexpressing human wild-type alpha-synuclein supports synaptic dysfunction and suggests mechanisms of neuroprotection for striatal neurons.Mol Neurodegener. 2011 Dec 13;6:83. doi: 10.1186/1750-1326-6-83. Mol Neurodegener. 2011. PMID: 22165993 Free PMC article.
-
Synaptic dysfunction in genetic models of Parkinson's disease: a role for autophagy?Neurobiol Dis. 2011 Jul;43(1):60-7. doi: 10.1016/j.nbd.2010.10.011. Epub 2010 Oct 20. Neurobiol Dis. 2011. PMID: 20969957 Free PMC article. Review.
-
A progressive mouse model of Parkinson's disease: the Thy1-aSyn ("Line 61") mice.Neurotherapeutics. 2012 Apr;9(2):297-314. doi: 10.1007/s13311-012-0104-2. Neurotherapeutics. 2012. PMID: 22350713 Free PMC article. Review.
References
-
- Abeliovich A, Schmitz Y, Farinas I, Choi-Lundberg D, Ho WH, Castillo PE, Shinsky N, Verdugo JM, Armanini M, Ryan A, Hynes M, Phillips H, Sulzer D, Rosenthal A. Mice lacking alpha-synuclein display functional deficits in the nigrostriatal dopamine system. Neuron. 2000;25:239–252. - PubMed
-
- Bamford NS, Zhang H, Schmitz Y, Wu NP, Cepeda C, Levine MS, Schmauss C, Zakharenko SS, Zablow L, Sulzer D. Heterosynaptic dopamine neurotransmission selects sets of corticostriatal terminals. Neuron. 2004;42:653–663. - PubMed
-
- Cabin DE, Shimazu K, Murphy D, Cole NB, Gottschalk W, McIlwain KL, Orrison B, Chen A, Ellis CE, Paylor R, Lu B, Nussbaum RL. Synaptic vesicle depletion correlates with attenuated synaptic responses to prolonged repetitive stimulation in mice lacking alpha-synuclein. J Neurosci. 2002;22:8797–8807. - PMC - PubMed
-
- ACalabresi P, Mercuri NB, Sancesario G, Bernardi G. Electrophysiology of dopamine-denervated striatal neurons. Implications for Parkinson's disease. Brain. 1993;116(Pt 2):433–452. - PubMed
Publication types
MeSH terms
Substances
Grants and funding
LinkOut - more resources
Full Text Sources
Other Literature Sources
Molecular Biology Databases
Miscellaneous
