. 2010 Mar;27(3):565-85.
doi: 10.1089/neu.2009.0966.

Long-term gliosis and molecular changes in the cervical spinal cord of the rhesus monkey after traumatic brain injury

Affiliations

Long-term gliosis and molecular changes in the cervical spinal cord of the rhesus monkey after traumatic brain injury

Kumi Nagamoto-Combs et al. J Neurotrauma. 2010 Mar.

Abstract

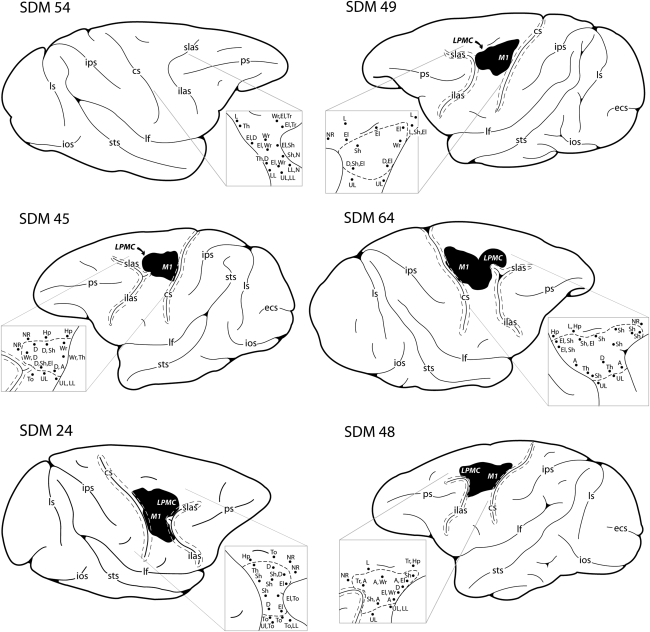
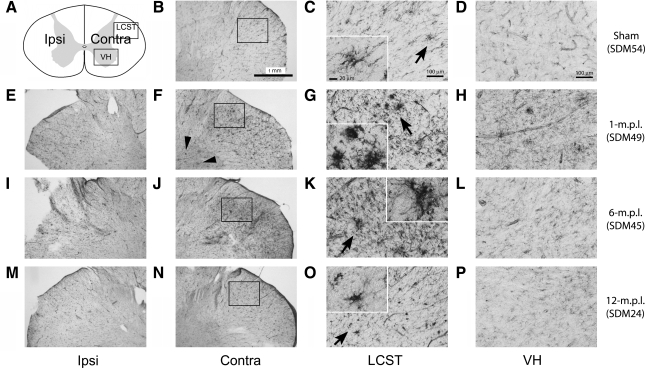
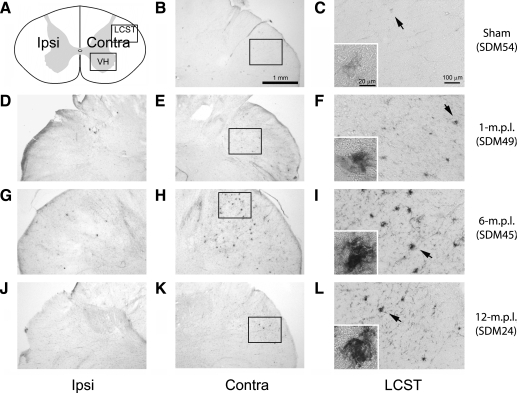
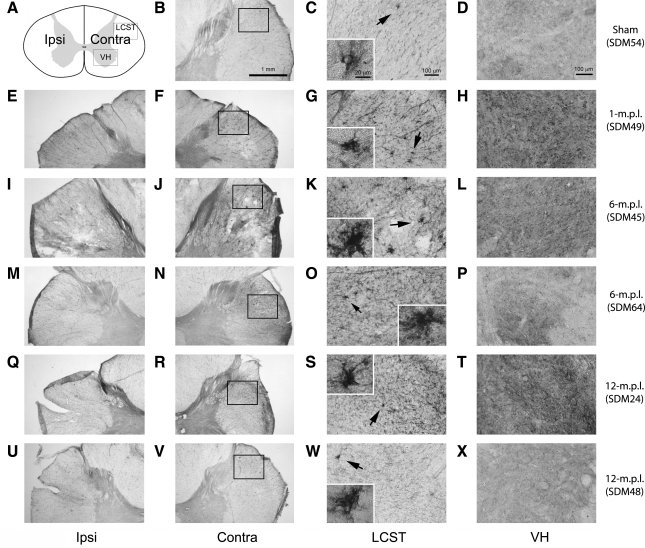
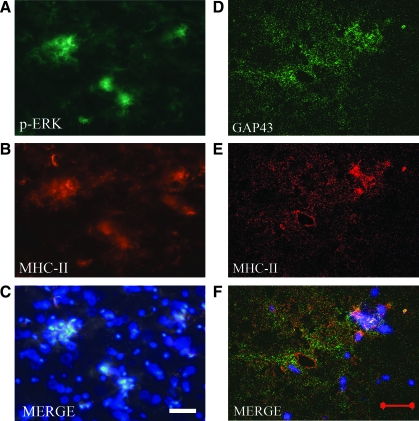
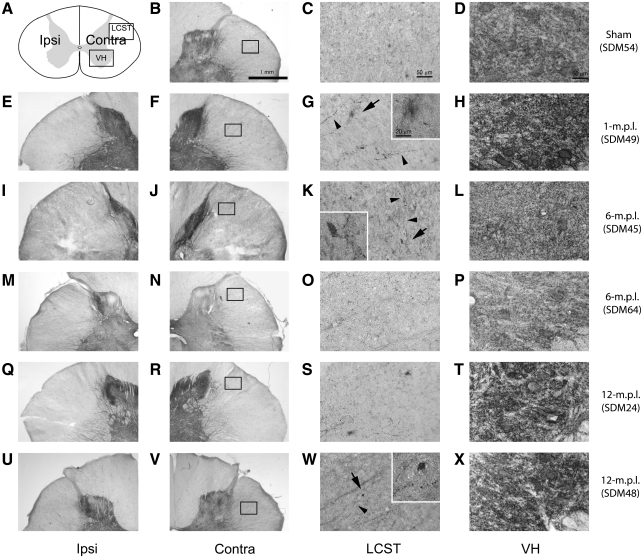
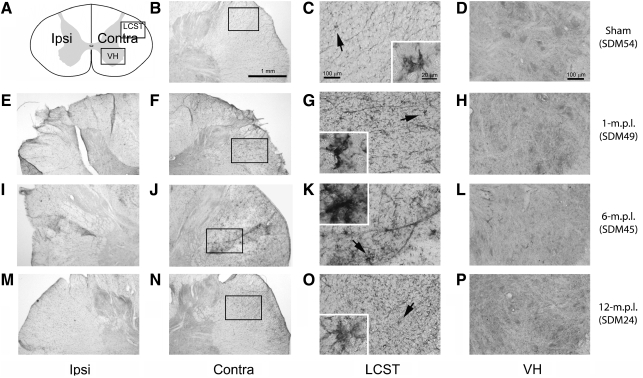
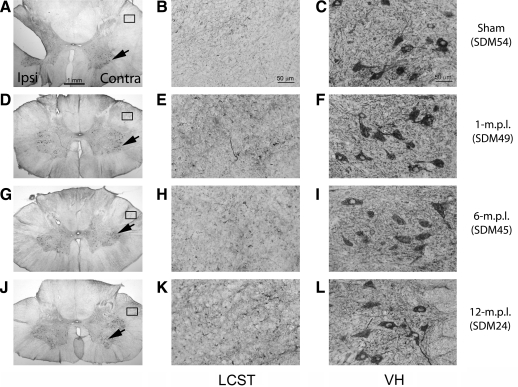
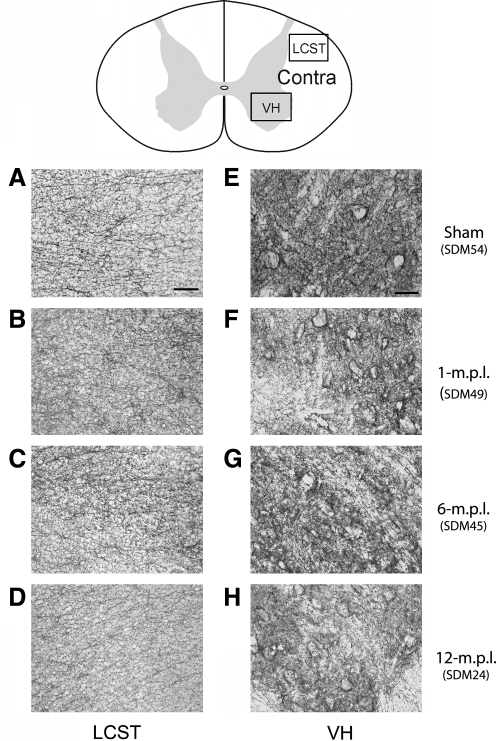
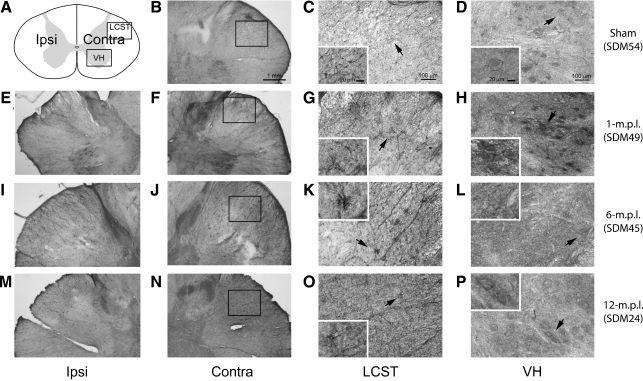
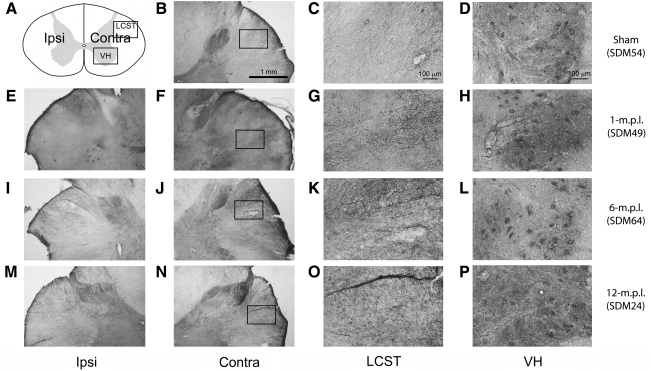
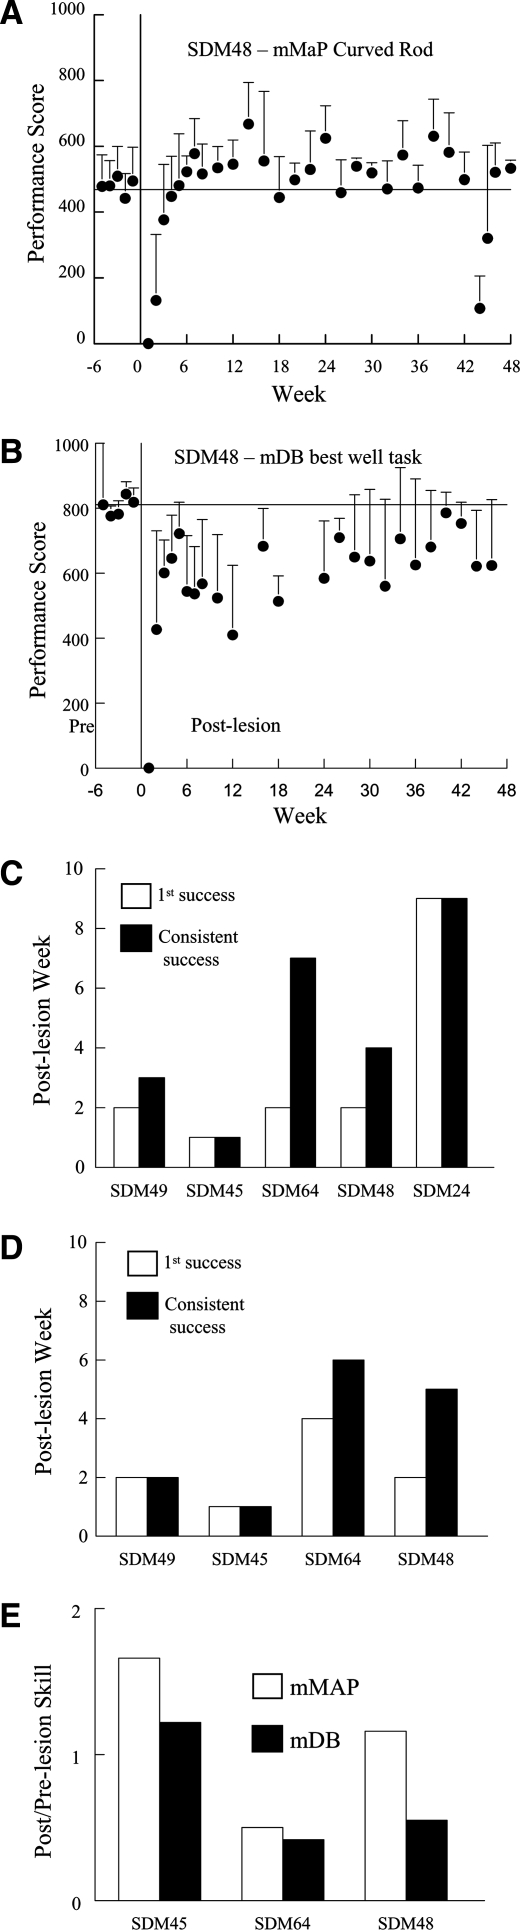
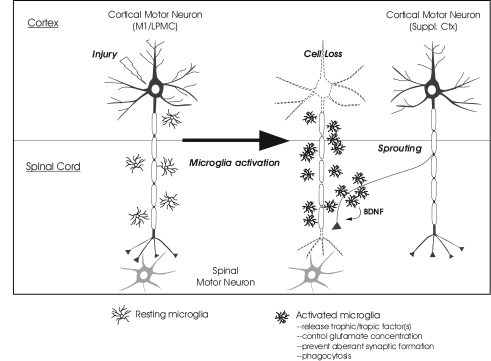
Recovery of fine motor skills after traumatic brain injury (TBI) is variable, with some patients showing progressive improvements over time while others show poor recovery. We therefore studied possible cellular mechanisms accompanying the recovery process in a non-human primate model system, in which the lateral frontal motor cortex areas controlling the preferred upper limb were unilaterally lesioned, and the animals eventually regained fine hand motor function. Immunohistochemical staining of the cervical spinal cord, the site of compensatory sprouting and degeneration of corticospinal axons, showed profound increases in immunoreactivities for major histocompatibility complex class II molecule (MHC-II) and extracellular signal-regulated kinases (ERK1/2) up to 12 months post lesion, particularly within the lateral corticospinal tract (LCST). Double immunostaining demonstrated that phosphorylated ERK1/2 colocalized within the MCH-II + microglia, suggesting a trophic role of long-term microglia activation after TBI at the site of compensatory sprouting. Active sprouting was observed in the LCST as well as in the spinal gray matter of the lesioned animals, as illustrated by increases in growth associated protein 43. Upregulation of Nogo receptor and glutamate transporter expression was also observed in this region after TBI, suggesting possible mechanisms for controlling aberrant sprouting and/or synaptic formation en route and interstitial glutamate concentration changes at the site of axon degeneration, respectively. Taken together, these changes in the non-human primate spinal cord support a long-term trophic/tropic role for reactive microglia, in particular, during functional and structural recovery after TBI.


Figures

FIG. 1.
FIG. 1.
Schematic diagrams of aspiration/coagulation lesion made in the lateral motor cortex of adult rhesus monkeys. The size and location of lesion in each case was confirmed using histological techniques and is indicated as the blackened area on the lateral cortical surface of the lesioned cases. The pullout shows the electrophysiological map that was generated following cortical exposure to localize the arm area of the primary motor cortex (M1) and dorsal lateral premotor cortex (LPMCd). A = arm, cs = central sulcus, D = digit, ecs = ectocalcarine sulcus, El = elbow, Hp = hip, ilas = inferior limb of the arcuate sulcus, ios = inferior occipital sulcus, ips = intraparietal sulcus, L = leg, lf = lateral fissure, LL = lower lip, LPMCd = dorsolateral premotor cortex, ls = lunate sulcus, M1 = primary motor cortex, N = neck, NR = no response, ps = principle sulcus, Sh = shoulder, slas = superior limb of the arcuate sulcus, sts = superior temporal sulcus, T = toe, Th = thumb, To = tongue, Tr = trunk, UL = upper lip, Wr = wrist.
FIG. 2.
FIG. 2.
MHC-II immunoreactivity increased in the LCST of the lower cervical spinal cord from adult rhesus monkeys after injury of the lateral motor cortex. (A) A schematic diagram of a transverse cervical spinal cord section. Contra/Ipsi indicates contralateral or ipsilateral side to each animal's lesion respectively. The rectangular boxes labeled LCST and VH indicate approximate areas where photomicrographs were taken for the lateral corticospinal tract and spinal gray matter in the ventral horn respectively. (BP) MHC-II positive cells were visualized using the ABC/Vector VIP immunodetection method in the transverse spinal-cord sections from the sham-operated control (B–D), 1- (E–H), 6- (I–L), and 12-m.p.l. (M–P) animals. The sections have been arranged so that the left-most panels, E, I, and M show low-magnification photographs of the ipsilateral LCST region, while F, J, and N show the contralateral side of each animal. The boxes within B, F, J, and N indicate the areas where high-power photomicrographs, C, G, K, and O, were taken. The inset in each of these photomicrographs shows a higher-power photomicrograph of the MHC-II-IR cell(s) designated by the arrow. Note the significant increases in MHC-II-IR and different morphology of the stained cells within the contralateral LCST regions of the lesioned animals (G, K, and O) compared to the sham-operated (C) animal. Panels D, H, L, and P depict MHC-II-IR within the ventral spinal gray matter (VH) of the sham-operated, 1-, 6-, or 12-m.p.l. animals respectively. Scale bar sizes are as indicated.
FIG. 3.
FIG. 3.
pERK immunoreactivity was elevated in the LCST of the lower cervical spinal cord from adult rhesus monkeys after injury of the lateral motor cortex. (A) A schematic diagram of a transverse cervical spinal-cord section. Contra/Ipsi indicates contralateral or ipsilateral side to each animal's lesion respectively. The rectangular box labeled LCST indicates approximate area of lateral corticospinal tract where photomicrographs were taken. (B–L): The immunoreactivity to pERK was visualized using the ABC/Vector VIP method in the transverse spinal cord sections from the sham-operated control (B and C), 1- (D–F), 6- (G–I), and 12-m.p.l. (J–L) animals. The sections have been arranged so that the left-most panels, D, G, and J, show low-magnification photographs of the ipsilateral LCST region, while E, H, and K show the contralateral side of each animal. The boxes within B, E, H, and K indicate the areas where high-power photomicrographs, C, F, I, and L, were taken. The inset in each of these photomicrographs shows a higher-power photomicrograph of the pERK-IR cell(s) designated by the arrow. Robust labeling for pERK-IR was observed in the contralateral LSCT region of each lesioned animal (F, I, and L) compared to that of the sham-operated animal (C). No significant labeling was found in the spinal gray matter. Scale bar sizes are as indicated.
FIG. 4.
FIG. 4.
GAP-43 immunoreactivity increased in the LCST of the lower cervical spinal cord of adult rhesus monkeys after injury of the lateral motor cortex. (A) A schematic diagram of a transverse cervical spinal-cord section. Contra/Ipsi indicates contralateral or ipsilateral side to each animal's lesion respectively. The rectangular boxes labeled LCST and VH indicate approximate areas where photomicrographs were taken for the lateral corticospinal tract and spinal gray matter in the ventral horn respectively. (BX) Transverse sections of the lower cervical spinal cord from the sham-operated (SDM54; B–D), 1- (SDM49; E–H), 6- (SDM45; I–L and SDM64; M–P), and 12-m.p.l. (SDM24; Q–T and SDM48; U–X) animals were immunostained for GAP-43 using the ABC/Vector VIP method. The sections have been arranged so that left-most panels E, I, M, Q, and U show low-magnification photographs of the ipsilateral LCST region, while F, J, N, R, and V show the contralateral side of each animal. The boxes within B, F, J, N, R, and V indicate the areas where high-power photomicrographs, C, G, K, O, S, and W, were taken. The inset in each of these photomicrographs shows a higher-power photomicrograph of the GAP-43-IR cell(s) designated by the arrow. The panels D, H, L, P, T, and X show GAP-43-IR in the spinal gray matter within the VH region. Specific recovery-time-dependent changes were not consistently observed. Scale bar sizes are as indicated.
FIG. 5.
FIG. 5.
MHC-II immunoreactivity overlapped that of pERK and was in proximity to that of GAP-43 within the LCST of the lower cervical spinal cord from the 1-m.p.l. adult rhesus monkey after injury of the lateral motor cortex. Transverse cervical spinal-cord sections from the 1-m.p.l. animal (SDM49) were processed for double immunofluorescent labeling against pERK (A, green) or GAP-43 (D, green) in conjunction with MHC-II (red, B, E). The merged images of pERK/MHC-II and GAP-43/MHC-II staining are shown in panels C and F respectively (MERGE). The blue fluorescence in panel C and F depicts nuclear labeling by DAPI. Photomicrographs were taken from the LCST region using a standard or confocal fluorescent microscope for pERK/MHC-II staining (A–C) and for GAP-43/MHCII (D–F) respectively. Note that pERK and MHC-II labels greatly overlap (C) while GAP-43 and MHC-II labels show little colocalization (F). Scale bar in panel C = 25 μm; scale bar in panel F = 20 μm.
FIG. 6.
FIG. 6.
Synaptophysin immunoreactivity showed modest increases in the LCST and ventral spinal gray matter of lower cervical spinal cords from only some of the lesioned animals after lateral motor cortex injury. (A) A schematic diagram of a transverse cervical spinal cord section. Contra/Ipsi indicate contralateral or ipsilateral side to each animal's lesion respectively. The rectangular boxes labeled LCST and VH indicate approximate areas where photomicrographs were taken for the lateral corticospinal tract and spinal gray matter in the ventral horn respectively. (BX) Transverse sections of the lower cervical spinal cord from the sham-operated (SDM54; B–D), 1- (SDM49; E–H), 6- (SDM45; I–L and SDM64; M–P), and 12-m.p.l. (SDM24; Q–T and SDM48; U–X) animals were immunostained for synaptophysin using the ABC/Vector VIP method. The sections have been arranged so that left-most panels E, I, M, Q, and U show low-magnification photographs of the ipsilateral LCST region, while F, J, N, R, and V show the contralateral side of each animal. The boxes within B, F, J, N, R, and V indicate the areas where high-power photomicrographs, C, G, K, O, S, and W, were taken. Synaptophysin-IR neurites were found most prominently in the spinal gray matter in all animals examined (D, H, L, P, T, and X). In the LCST region, no striking differences were observed between the lesioned and sham-operated animals, though slightly more synaptophysin-labeled neurites were found in SDM49 (G) and SDM45 (K), and also to a lesser extent in SDM48 (W). As depicted in panels G, K, and W, the labeled neurites (arrowheads) appeared to be in close proximity to a lightly stained cell or cluster-like structure(s) (arrows), which is shown at a higher power in the inset. Scale bar sizes are as indicated.
FIG. 7.
FIG. 7.
NgR immunoreactivity increased in the LCST of lower cervical spinal cords of adult rhesus monkeys after injury of the lateral motor cortex. (A) A schematic diagram of a transverse cervical spinal cord section. Contra/Ipsi indicate contralateral or ipsilateral side to each animal's lesion respectively. The rectangular boxes labeled LCST and VH indicate approximate areas where photomicrographs were taken for the lateral corticospinal tract and spinal gray matter in the ventral horn respectively. (BP) Transverse sections from the lower cervical spinal cords from the sham-operated (B–D), 1- (E–H), 6- (I–L), and 12-m.p.l. (M–P) animals were immunostained for NgR using the ABC/Vector VIP method. The sections have been arranged so that left-most panels E, I, and M show low-magnification photographs of the ipsilateral LCST region, while F, J, and N show the contralateral side of each animal. When compared to the sham control (C), profound NgR-IR was detected in this region of the 1- (G) and 6-m.p.l. (K) animals, and of the 12-m.p.l. animal (O) to a lesser extent. The boxes within B, F, J, and N indicate the areas where high-power photomicrographs, C, G, K, and O, were taken. The inset in each of these panels shows a higher-power photograph of the NgR-immunoreactive structure indicated by the arrow. Panels D, H, L, and P show NgR labeling in the spinal gray matter within the VH region. Scale bar sizes are as indicated.
FIG. 8.
FIG. 8.
Nogo A immunoreactivity did not appreciably change in the LCST or VH in the lower cervical spinal cords of adult rhesus monkeys after injury of the lateral motor cortex. Transverse sections from the lower cervical spinal cords of the sham-operated (A–C), 1- (D–F), 6- (G–I), and 12-m.p.l. (JL) animals were immunostained for Nogo A using the ABC/Vector VIP method. The sections are arranged so that left side of each photograph is the ipsilateral side to each animal's lesion. (A, D, G, and J) Low-power photographs. The rectangles and arrows in these panels respectively indicate where the high-power photographs of the LCST (B, E, H, and K) and ventral spinal gray matter (C, F, I, and L) from the corresponding animals were taken. Scale bar sizes are as indicated.
FIG. 9.
FIG. 9.
GFAP immunoreactivity did not change in the LCST or VH in the lower cervical spinal cords of adult rhesus monkeys at different recovery time points after injury of the lateral motor cortex. Transverse sections of the lower cervical spinal cords from the sham-operated (A, E), 1- (B, F), 6- (C, G), and 12-m.p.l. (D, H) animals were immunostained for GFAP using the ABC/Vector VIP method. The schematic drawing of the spinal cord section indicates the orientation of the sections and the approximate areas of lateral corticospinal tract (LCST) and ventral spinal gray matter (VH) where the photographs A–D and E–H were taken respectively. Only the contralateral (Contra) sides of the sections are shown. No significant temporal change in GFAP-IR was detected at the examined recovery time points. Scale bar = 50 μm.
FIG. 10.
FIG. 10.
GLT-1 immunoreactivity increased in the LCST and VH in the lower cervical spinal cord of adult rhesus monkeys after injury in the lateral motor cortex. (A) A schematic diagram of a transverse cervical spinal cord section. Contra/Ipsi indicate contralateral or ipsilateral side to each animal's lesion respectively. The rectangular boxes labeled LCST and VH indicate approximate areas where photomicrographs were taken for the lateral corticospinal tract and spinal gray matter in the ventral horn respectively. (BP) GLT-1 positive cells were visualized using the ABC/Vector VIP immunodetection method in the transverse spinal-cord sections from the sham-operated control (B–D), 1- (E–H), 6- (I–L), and 12-m.p.l. (M–P) animals. The sections have been arranged so that left-most panels, E, I, and M, show low-magnification photographs of the ipsilateral LCST region, while F, J, and N show the contralateral side of each animal. The boxes within B, F, J, and N indicate the areas of LCST where the high power photomicrographs, C, G, K, and O, were taken. The inset in each of these photomicrographs shows a higher-power photomicrograph of the GLT-1 immunoreactive area designated by the arrow. Note the presence of different morphology in the LCST of the lesioned animals, especially in the 1- and 6-m.p.l. animals (G and K respectively) compared to the sham-operated animal (C). Panels D, H, L, and P depict GLT-1-IR within the ventral spinal gray matter (VH) of the sham-operated, 1-, 6-, or 12-m.p.l. animals respectively. The inset photographs in these panels also show higher-power images of the areas designated by the arrows, illustrating immunolabeling around motor neurons. Scale bar sizes are as indicated.
FIG. 11.
FIG. 11.
GLAST immunoreactivity increased in LCST and VH in the lower cervical spinal cord of adult rhesus monkeys after injury in the lateral motor cortex. (A) A schematic diagram of a transverse cervical spinal cord section. Contra/Ipsi indicate contralateral or ipsilateral side to each animal's lesion respectively. The rectangular boxes labeled LCST and VH indicate approximate areas where photomicrographs were taken for the lateral corticospinal tract and spinal gray matter in the ventral horn, respectively. (B–P) GLAST-IR was visualized using the ABC/Vector VIP immunodetection method in the transverse spinal cord sections from the sham-operated control (B–D), 1- (E–H), 6- (I–L), and 12-m.p.l. (M–P) animals. The sections have been arranged so that left-most panels, E, I, and M, show low-magnification photographs of the ipsilateral LCST region, while F, J, and N show the contralateral side of each animal. The boxes within B, F, J, and N indicate the areas of LCST where the high power photomicrographs, C, G, K, and O, were taken. Overall increases in the staining in this region were observed in the lesioned animals (G, K, and O) compared to the sham control (C). GLAST-IR was also found in the ventral spinal gray matter in all the animals examined (D, H, L, and P). There seem to be diffuse increases in the GLAST-IR surrounding strongly immunopositive motor neurons, although any obvious temporal pattern in the staining intensity was not determined. Scale bar sizes are as indicated.
FIG. 12.
FIG. 12.
Recovery of fine motor function after lesion to M1 and LPMC. Average performance scores from individual testing sessions on the mMAP (A) and mDB (B) tasks for the final five pre-lesion testing sessions and for all post-lesion testing sessions for one monkey (SDM48). Each plotted symbol shows the mean performance score for five trials in a single test session in A and B (error bars are 1 standard deviation). C and D show the post-lesion week of first successful acquisition of the food targets (white bar) and consistent successful acquisition (i.e., on all trials – black bar) for the mMAP curved rod (C) and mDB best well (D) tasks for each monkey. The ratio of post-lesion skill to pre-lesion skill in the mMAP curved rod (white bar) and mDB best well (black bar) tasks is shown in E. Note that SDM24 only performed the mMAP task without the load cell. Thus, there are no data presented for this animal on the mDB task in D and recovery of skill is not presented for the mMAP task in E.
FIG. 13.
FIG. 13.
Hypothesized contribution of prolonged microglial activation to surviving neuron sprouting and functional recovery. Potential events following injury to the upper motor neuron in the primary motor cortex or lateral premotor cortex (M1/LPMC) are schematically presented. Injury-mediated loss of the cortical motor neuron (shown as the neuron with dotted outline) causes degeneration of its descending axon and activation of microglia in the spinal cord. These reactive microglia may promote neurite sprouting from spared neurons of the supplemental motor cortex (Suppl. Ctx) by supplying trophic factors such as BDNF as well as by preventing aberrant synapse formation. They may also participate in maintenance of local environment by facilitating glutamate uptake and phagocytosis.

Similar articles

Cited by

References

    1. Agrawal S.K. Fehlings M.G. Role of NMDA and non-NMDA ionotropic glutamate receptors in traumatic spinal cord axonal injury. J. Neurosci. 1997;17:1055–1063. - PMC - PubMed
    1. Agrawal S.K. Theriault E. Fehlings M. Role of group I metabotropic glutamate receptors in traumatic spinal cord white matter injury. J. Neurotrauma. 1998;15:929–941. - PubMed
    1. Ashwal S. Holshouser B. Tong K. Serna T. Osterdock R. Gross M. Kido D. Proton MR spectroscopy detected glutamate/glutamine is increased in children with traumatic brain injury. J. Neurotrauma. 2004;21:1539–1552. - PubMed
    1. Batchelor P.E. Liberatore G.T. Porritt M.J. Donnan G.A. Howells D.W. Inhibition of brain-derived neurotrophic factor and glial cell line-derived neurotrophic factor expression reduces dopaminergic sprouting in the injured striatum. Eur. J. Neurosci. 2000;12:3462–3468. - PubMed
    1. Batchelor P.E. Porritt M.J. Martinello P. Parish C.L. Liberatore G.T. Donnan G.A. Howells D.W. Macrophages and microglia produce local trophic gradients that stimulate axonal sprouting toward but not beyond the wound edge. Mol. Cell Neurosci. 2002;21:436–453. - PubMed

Publication types

MeSH terms