. 2009 Dec 23:4:53.
doi: 10.1186/1750-1326-4-53.

ZnT3 mRNA levels are reduced in Alzheimer's disease post-mortem brain

Affiliations

ZnT3 mRNA levels are reduced in Alzheimer's disease post-mortem brain

Nancy Beyer et al. Mol Neurodegener. .

Abstract

Background: ZnT3 is a membrane Zn(2+ )transporter that is responsible for concentrating Zn(2+ )into neuronal presynaptic vesicles. Zn(2+ )homeostasis in the brain is relevant to Alzheimer's disease (AD) because Zn(2+ )released during neurotransmission may bind to Abeta peptides, accelerating the assembly of Abeta into oligomers which have been shown to impair synaptic function.

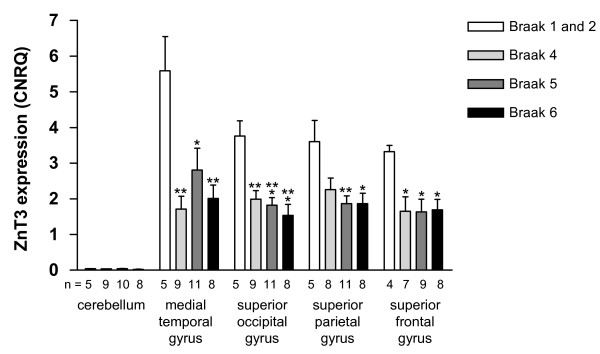
Results: We quantified ZnT3 mRNA levels in Braak-staged human post mortem (pm) brain tissue from medial temporal gyrus, superior occipital gyrus, superior parietal gyrus, superior frontal gyrus and cerebellum from individuals with AD (n = 28), and matched controls (n = 5) using quantitative real-time PCR. ZnT3 mRNA levels were significantly decreased in all four cortical regions examined in the AD patients, to 45-60% of control levels. This reduction was already apparent at Braak stage 4 in most cortical regions examined. Quantification of neuronal and glial-specific markers in the same samples (neuron-specific enolase, NSE; and glial fibrillary acidic protein, GFAP) indicated that loss of cortical ZnT3 expression was more pronounced, and occurred prior to, significant loss of NSE expression in the tissue. Significant increases in cortical GFAP expression were apparent as the disease progressed. No gene expression changes were observed in the cerebellum, which is relatively spared of AD neuropathology.

Conclusions: This first study to quantify ZnT3 mRNA levels in human pm brain tissue from individuals with AD and controls has revealed a significant loss of ZnT3 expression in cortical regions, suggesting that neuronal cells in particular show reduced expression of ZnT3 mRNA in the disease. This suggests that altered neuronal Zn(2+ )handling may be an early event in AD pathogenesis.


Figures

Figure 1
Figure 1
ZnT3 efficiency plot. Quadruplicate ZnT3 qPCR analyses were carried out using the indicated dilutions of a cDNA pool, derived as described in the Methods section. Mean Ct values ± SD are presented for each dilution where the assay signal rose above the detection threshold. PCR reaction efficiency for the ZnT3 TaqMan assay (85%) was calculated from the slope of the line as described in the Methods section.
Figure 2
Figure 2
ZnT3 expression in AD and control brain tissue. RNA was isolated from the pm brain tissue regions indicated and reverse transcribed prior to qPCR analysis in triplicate, and data analysis using qBase Plus, as described in the Methods section. Columns represent the mean ZnT3 expression level (expressed as CNRQ) ± SEM for each Braak stage, and the numbers at the base of each column (n) indicate the number of individuals included in that analysis. Statistical analysis (one-way ANOVA and Tukey-Kramer multiple comparisons test) revealed significant differences between control ZnT3 expression levels (Braak stages 1 and 2), and ZnT3 expression levels in the AD brain tissue (Braak stages 4, 5, and 6): * p < 0.05; ** p < 0.01; *** p < 0.001 compared to control ZnT3 expression in the same brain region.
Figure 3
Figure 3
ZnT3/NSE and ZnT3/GFAP CNRQ in AD and control brain tissue. ZnT3 mean CNRQ values were divided by either mean NSE CNRQ, or mean GFAP CNRQ, for the same sample. This produced the ratios, which are shown plotted against the relevant Braak stage for that sample. Spearman correlation coefficients (r) are displayed on each graph, alongside the relevant p value.

References

    1. Palmiter RD, Cole TB, Quaife CJ, Findley SD. ZnT-3, a putative transporter of zinc into synaptic vesicles. Proc Natl Acad Sci USA. 1996;93:14934–14939. doi: 10.1073/pnas.93.25.14934. - DOI - PMC - PubMed
    1. Wenzel HJ, Cole TB, Born DE, Schwartzkroin PA, Palmiter RD. Ultrastructural localization of zinc transporter-3 (ZnT-3) to synaptic vesicle membranes within mossy fiber boutons in the hippocampus of mouse and monkey. Proc Natl Acad Sci USA. 1997;94:12676–12681. doi: 10.1073/pnas.94.23.12676. - DOI - PMC - PubMed
    1. Cole TB, Wenzel HJ, Kafer KE, Schwartzkroin PA, Palmiter RD. Elimination of zinc from synaptic vesicles in the intact mouse brain by disruption of the ZnT3 gene. Proc Natl Acad Sci USA. 1999;96:1716–1721. doi: 10.1073/pnas.96.4.1716. - DOI - PMC - PubMed
    1. Budde T, Minta A, White JA, Kay AR. Imaging free zinc in synaptic terminals in live hippocampal slices. Neuroscience. 1997;79:347–358. doi: 10.1016/S0306-4522(96)00695-1. - DOI - PubMed
    1. Datki ZL, Hunya A, Penke B. A novel and simple fluorescence method for the measurement of presynaptic vesicular zinc release in acute hippocampal slices with a fluorescence plate reader. Brain Res Bull. 2007;74:183–187. doi: 10.1016/j.brainresbull.2007.06.001. - DOI - PubMed

LinkOut - more resources