Review
. 2010 Jan 21;98(1):77-94.
doi: 10.1016/j.jphotobiol.2009.11.007. Epub 2009 Nov 26.

Pre-clinical whole-body fluorescence imaging: Review of instruments, methods and applications

Affiliations
Review

Pre-clinical whole-body fluorescence imaging: Review of instruments, methods and applications

Frederic Leblond et al. J Photochem Photobiol B. .

Abstract

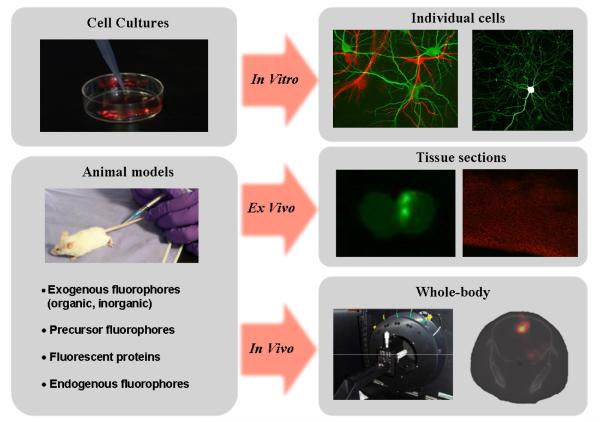
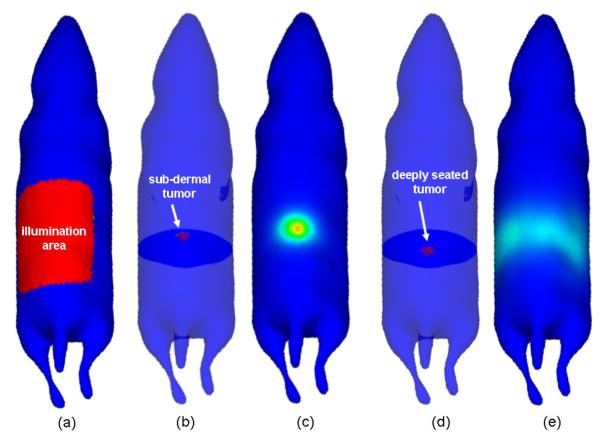
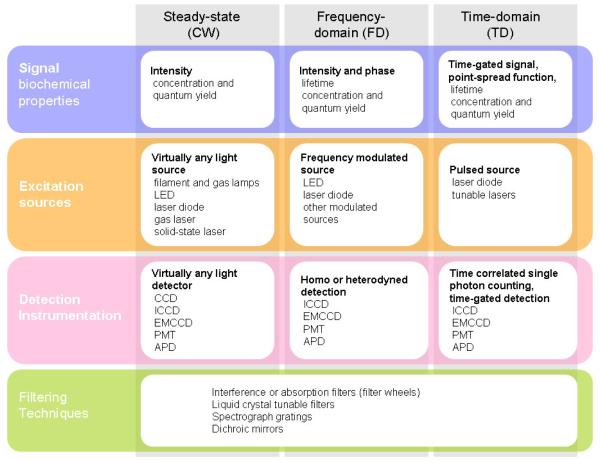
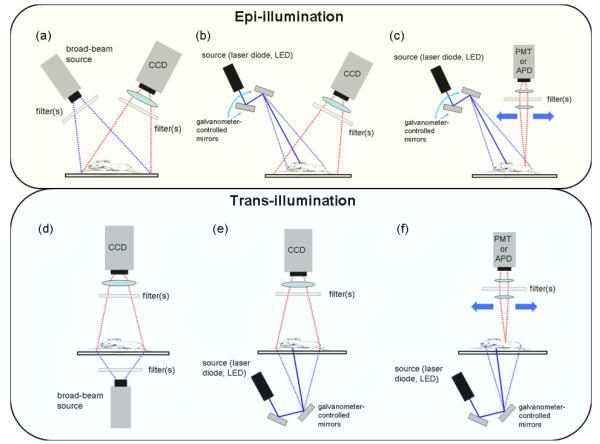
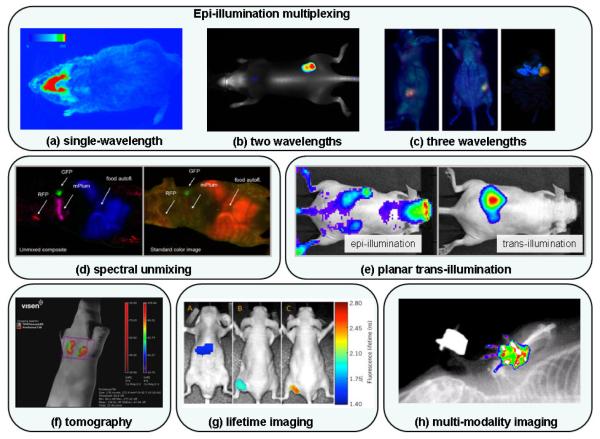
Fluorescence sampling of cellular function is widely used in all aspects of biology, allowing the visualization of cellular and sub-cellular biological processes with spatial resolutions in the range from nanometers up to centimeters. Imaging of fluorescence in vivo has become the most commonly used radiological tool in all pre-clinical work. In the last decade, full-body pre-clinical imaging systems have emerged with a wide range of utilities and niche application areas. The range of fluorescent probes that can be excited in the visible to near-infrared part of the electromagnetic spectrum continues to expand, with the most value for in vivo use being beyond the 630 nm wavelength, because the absorption of light sharply decreases. Whole-body in vivo fluorescence imaging has not yet reached a state of maturity that allows its routine use in the scope of large-scale pre-clinical studies. This is in part due to an incomplete understanding of what the actual fundamental capabilities and limitations of this imaging modality are. However, progress is continuously being made in research laboratories pushing the limits of the approach to consistently improve its performance in terms of spatial resolution, sensitivity and quantification. This paper reviews this imaging technology with a particular emphasis on its potential uses and limitations, the required instrumentation, and the possible imaging geometries and applications. A detailed account of the main commercially available systems is provided as well as some perspective relating to the future of the technology development. Although the vast majority of applications of in vivo small animal imaging are based on epi-illumination planar imaging, the future success of the method relies heavily on the design of novel imaging systems based on state-of-the-art optical technology used in conjunction with high spatial resolution structural modalities such as MRI, CT or ultrasound.


Figures

Figure 1
Figure 1
Illustration showing different fluorescence imaging paths used in the scope of preclinical studies. High resolution, high sensitivity and high specificity images can be rendered down to sub-micron resolution in vitro to study cellular and sub-cellular molecular processes. The top-right part of the figure shows two-photon microscopy images of mouse hippocampal neuron and glial cells transfected with GFP and RFP, respectively (courtesy of Dr Paul De Koninck, www.greenspine.ca). Animal models can be used for ex vivo studies of tissue slices as well as for whole-body in vivo studies. Ex vivo slices shown (middle-right images) correspond to brain tissue with glioma cells highlighted with fluorescence from GFP and the endogenous molecule Protoporphyrin IX. The in vivo whole-body image (lower-right in the figure) corresponds to a fluorescence tomography image associated with PpIX contrast from a brain tumor model.
Figure 2
Figure 2
Images showing the impact photon scattering can have on fluorescence imaging in living tissue. Two numerically simulated mouse models were used. An 8 mm diameter spherical tumor was located in the abdomen in each simulated mouse: (b) near the surface, (d) close to the axial center of the animal. Simulation results are shown for broad beam epi-illumination imaging: (a) shows the illuminated area on the surface of the animal while (c) and (e) show the outgoing light at the surface for the tumors shown in (b) and (d), respectively. In both cases, no background fluorescence was assumed. The intensity of the outgoing light in (e) is approximately one-thousandth of that shown in (c).
Figure 3
Figure 3
Three major hardware design strategies for in vivo fluorescence imaging are shown in the columns of the table. Comparison of the imaging approaches is provided in terms of the main four components needed for each. They are listed in the rows where the intersection boxes detail the relevant data or components.
Figure 4
Figure 4
Schematic rendering of different methods that can be used for whole-body fluorescence imaging. The first row shows epi-illumination geometries: (a) broad beam illumination with wide-field camera detection; (b) raster-scan illumination with wide-field camera detection, (c) raster-scan illumination and detection. The lower row of images shows the corresponding trans-illumination configurations. Not shown in the figure are configurations optimized for tomography imaging and fiber-based planar configurations.
Figure 5
Figure 5
Whole-body fluorescence images acquired in vivo with existing commercial systems: (a) Single-wavelength image (excitation: ~680 nm, emission: ~720 nm) of an oxazine-derivate dye binding to beta-amyloid deposits present in Alzheimer’s disease (NightOWL-LB 983, courtesy of Berthold Technologies). (b) Tumor grown sub-cutaneously on right hip from A431 tumor cells. Image shows contrast associated with IRDye680 BoneTag (grayscale, excitation: 680 nm, emission: ~700 nm) and IRDye800CW EGF (pseudo-color, excitation: 780 nm, emission: ~800 nm) (Pearl Imager, courtesy of LI-COR Biosciences). (c) Imaging of XPA-1 tumors grown orthotopically in transgenic CFP nude mice from pancreatic cancer cells transfected with two fluorescent proteins to express GFP in the nucleus and RFP in the cytoplasm. Images show the dual-colored tumor in red (RFP) and green (GFP) color scales, while the pancreas and rest of the mouse appear in blue from the CFP [178] (iBox). (d) Images from a nude mouse with three sub-dermal tumors labeled with fluorescent proteins. The left-most image shows a representation of the fluorescence emanating from the animal (no spectral decomposition) while the other image is a composite combining the spectrally unmixed GFP, RFP and mPlum-FP images (green, red and magenta color scales, respectively) and the food autofluorescence (in blue) [6] (Maestro). (e) Images of approximately 1×10¹³ quantum dots (excitation: ~800 nm) implanted medial to the left kidney. The deeply-seated distribution of fluorescent molecules cannot be distinguished from autofluorescence sources in the epi-illumination image (left) but is clearly visible on the trans-illumination image (right) (IVIS Spectrum, courtesy of Caliper Life Sciences). (f) Multiplexed quantification of metalloproteinase and cathepsin activity in 4T1 mammary fat pas tumors. Fluorescence tomography image shows contrast from agents ProSense 750 (distributed throughout the tumor – red color scale) and MMPSense 680 (distributed on the surface of the tumor - in green) (FT 2500, courtesy of VisEn Medical). (g) Simultaneous lifetime imaging of two molecular biomarkers binding to cancer in xenograft mouse model (U-87MG glioblastoma cell line with mutation in EGF receptor) injected in flank of a nude mouse: lifetime of C225-Cy5.5 (C225 antibody-Cetuximab, an EGFR targeting antibody) in liver (image A), in the tumor (image B) and of Tf-DY682 (transferrin protein binding to transferrin receptors) in the tumor (image C) (Optix MX2, courtesy of ART Advanced Research and Technologies). (h) Combined digital X-ray image fluorescence image (excitation: ~720nm, emission: ~790nm) (KODAK In Vivo Imaging System, courtesy of Carestream Health).

Similar articles

Cited by

References

    1. Jacques SL, Pogue BW. Tuturial on diffuse light transport. Journal of Biomedical Optics. 2008;13(4):041302. - PubMed
    1. Swartling J, et al. Fluorescence spectra provide information on the depth of fluorescent lesions in tissue. Applied Optics. 2005;44(10):1934–1941. - PubMed
    1. Davis SC, et al. Contrast-Detail Analysis Characterizes Diffuse Optical Fluorescence Tomography Image Reconstruction. Journal of Biomedical Optics. 2005;10(5):050501-1–3. - PubMed
    1. Billinton N, Knight AW. Seeing the Wood through the Trees: A Review of Techniques for Distinguishing Green Fluorescent Protein from Endogenous Autofluorescence. Analytical Biochemistry. 2001;291:175–197. - PubMed
    1. Wagnieres GA, Star WM, Wilson BC. In vivo fluorescence spectroscopy and imaging for oncological applications. Photochemistry & Photobiology. 1998;68(5):603–32. - PubMed

Publication types

MeSH terms

LinkOut - more resources