. 2010 Feb 15;26(4):518-28.
doi: 10.1093/bioinformatics/btp694. Epub 2009 Dec 23.

Power to detect selective allelic amplification in genome-wide scans of tumor data

Affiliations

Power to detect selective allelic amplification in genome-wide scans of tumor data

Ninad Dewal et al. Bioinformatics. .

Abstract

Motivation: Somatic amplification of particular genomic regions and selection of cellular lineages with such amplifications drives tumor development. However, pinpointing genes under such selection has been difficult due to the large span of these regions. Our recently-developed method, the amplification distortion test (ADT), identifies specific nucleotide alleles and haplotypes that confer better survival for tumor cells when somatically amplified. In this work, we focus on evaluating ADT's power to detect such causal variants across a variety of tumor dataset scenarios.

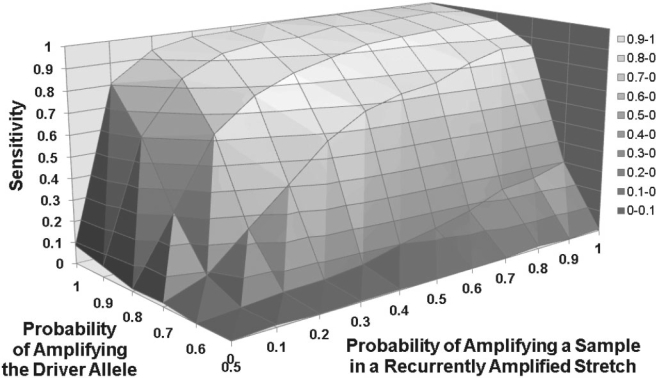
Results: Towards this end, we generated multiple parameter-based, synthetic datasets-derived from real data-that contain somatic copy number aberrations (CNAs) of various lengths and frequencies over germline single nucleotide polymorphisms (SNPs) genome-wide. Gold-standard causal sub-regions were assigned within these CNAs, followed by an assessment of ADT's ability to detect these sub-regions. Results indicate that ADT possesses high sensitivity and specificity in large sample sizes across most parameter cases, including those that more closely reflect existing SNP and CNA cancer data.


Figures

Fig. 1.
Fig. 1.
Amplified regions within a chromosome. The figure displays an example of amplification status of calls across a chromosome as observed in real data. Recurrent stretches (or regions) of amplification are denoted by lines that span across many of the samples, highlighted by the translucent rectangle, with the driver SNP located at the midpoint, as indicated by the dotted line. Non-recurrent (or sample-specific) amplified regions are represented as stray stretches. During the evaluation experiments that simulate such data, four parameters are defined and tested: (i) the mean length of recurrently amplified regions in base pairs, (ii) the number of recurrently amplified regions across the genome, (iii) the mean length of non-recurrently (or sample specific) amplified regions in base pairs, and (iv) the number of non-recurrently (or sample specific) amplified regions per sample.
Fig. 2.
Fig. 2.
Sensitivity across value combinations of two parameters. Dataset B: 698 Samples. The two parameters are denoted on the z- and x-axes and have the ability to significantly affect sensitivity of ADT. This graph is produced from performing simulations on the 698 sample Affymetrix 250K dataset. Sensitivity jumps when the sample amplification parameter reaches 0.1 but tapers afterwards. Sensitivity also increases when the driver allele amplification parameter reaches 0.7. Sensitivity at the default parameter values (0.2 for sample amplification and 0.9 for driver allele amplification) reaches 0.84. Considering the default parameter values represent properties seen in real data, this indicates that ADT will perform well on real datasets with large sample sizes.
Fig. 3.
Fig. 3.
ADT binomial test results. Dataset A: 204 samples. This displays a Manhattan plot of amplification distortion p-values (y-axis in a −log10 scale) along the genome (x-axis). Signals on chromosome 7 exceed the 3.61 genome-wide significance threshold, indicated by the horizontal line. Only two SNPs cross this threshold (rs1997375, rs10250847). The SNP rs10250847 passes certain quality control criteria and may motivate further biological investigation. The distribution of the ADT binomial test statistic is provided in a quantile–quantile (QQ) plot in Supplementary Figure 30.

Similar articles

Cited by

References

    1. Ahmed S, et al. Newly discovered breast cancer susceptibility loci on 3p24 and 17q23.2. Nat. Genet. 2009;41:585–590. - PMC - PubMed
    1. Amos CI, et al. Genome-wide association scan of tag SNPs identifies a susceptibility locus for lung cancer at 15q25.1. Nat. Genet. 2008;40:616–622. - PMC - PubMed
    1. Amundadottir LT, et al. A common variant associated with prostate cancer in European and African populations. Nat. Genet. 2006;38:652–658. - PubMed
    1. Bentz M, et al. Minimal sizes of deletions detected by comparative genomic hybridization. Genes Chromosomes Cancer. 1998;21:172–175. - PubMed
    1. Browning SR, Browning BL. Rapid and accurate haplotype phasing and missing-data inference for whole-genome association studies by use of localized haplotype clustering. Am. J. Hum. Genet. 2007;81:1084–1097. - PMC - PubMed

Publication types