

Coactivation of gustatory and olfactory signals in flavor perception
- PMID: 20032112
- PMCID: PMC2805810
- DOI: 10.1093/chemse/bjp089
Coactivation of gustatory and olfactory signals in flavor perception
Abstract
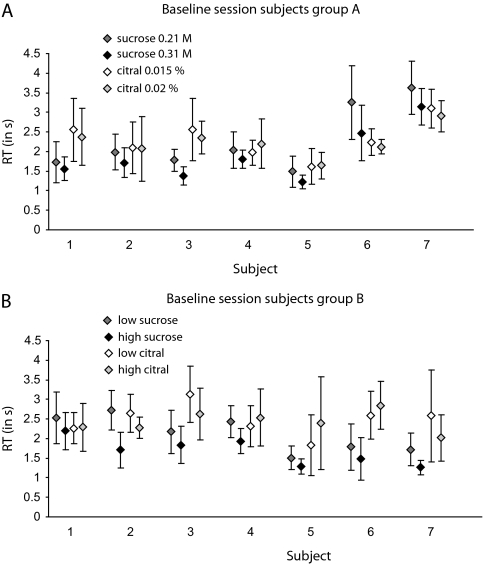
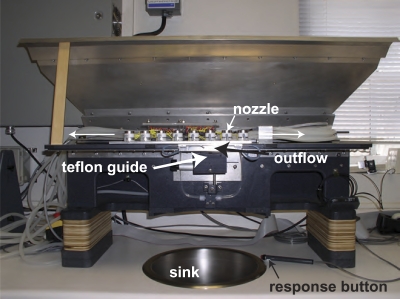
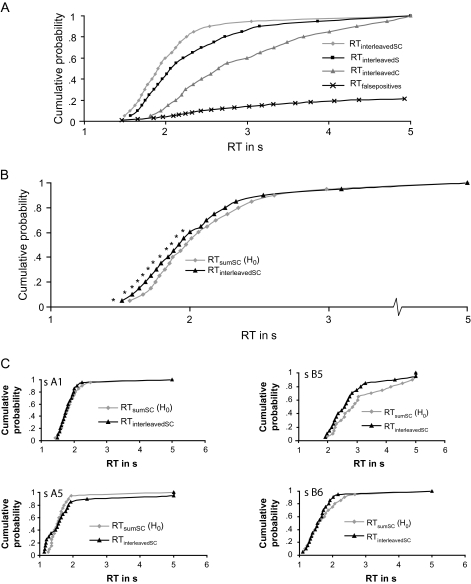
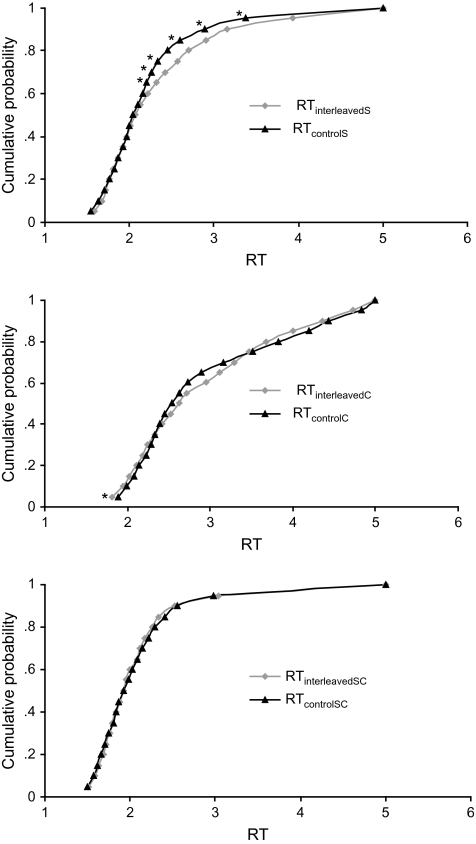
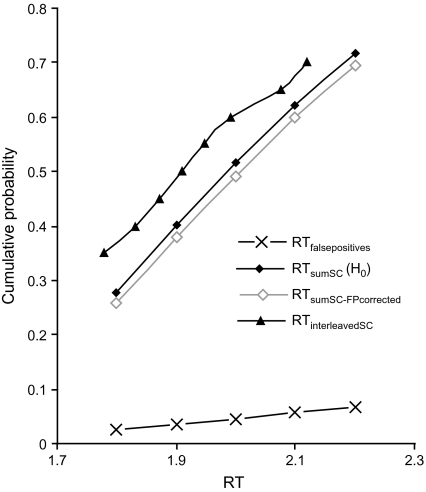
It is easier to detect mixtures of gustatory and olfactory flavorants than to detect either component alone. But does the detection of mixtures exceed the level predicted by probability summation, assuming independent detection of each component? To answer this question, we measured simple response times (RTs) to detect brief pulses of one of 3 flavorants (sucrose [gustatory], citral [olfactory], sucrose-citral mixture) or water, presented into the mouth by a computer-operated, automated flow system. Subjects were instructed to press a button as soon as they detected any of the 3 nonwater stimuli. Responses to the mixtures were faster (RTs smaller) than predicted by a model of probability summation of independently detected signals, suggesting positive coactivation (integration) of gustation and retronasal olfaction in flavor perception. Evidence for integration appeared mainly in the fastest 60% of the responses, indicating that integration arises relatively early in flavor processing. Results were similar when the 3 possible flavorants, and water, were interleaved within the same session (experimental condition), and when each flavorant was interleaved with water only (control conditions). This outcome suggests that subjects did not attend selectively to one flavor component or the other in the experimental condition and further supports the conclusion that (late) decisional or attentional strategies do not exert a large influence on the gustatory-olfactory flavor integration.
Figures
References
-
- Alais D, Burr D. The ventriloquist effect results from near-optimal bimodal integration. Curr Biol. 2004;14:257–262. - PubMed
-
- Ashkenazi A, Fritz M, Buckley J, Marks LE. The Temporal Automated System for Taste Experiments (TASTE) Behav Res Methods Instrum Comput. 2004;36:83–88. - PubMed
-
- Ashkenazi A, Marks LE. Effect of endogenous attention on detection of weak gustatory and olfactory flavors. Percept Psychophys. 2004;66:596–608. - PubMed
-
- Auvray M, Spence C. The multisensory perception of flavor. Conscious Cogn. 2008;17:1016–1031. - PubMed
-
- Bartoshuk LM, Duffy VB, Chapo AK, Fast K, Yiee JH, Hoffman HJ, Ko C-W, Snyder DJ. From psychophysics to the clinic: missteps and advances. Food Qual Pref. 2004;15:617–632.
Publication types
MeSH terms
Substances
Grants and funding
LinkOut - more resources
Full Text Sources
Molecular Biology Databases
