. 2010 Mar;298(3):F601-8.
doi: 10.1152/ajprenal.00424.2009. Epub 2009 Dec 23.

Expression of transporters involved in urine concentration recovers differently after cessation of lithium treatment

Affiliations

Expression of transporters involved in urine concentration recovers differently after cessation of lithium treatment

Mitsi A Blount et al. Am J Physiol Renal Physiol. 2010 Mar.

Abstract

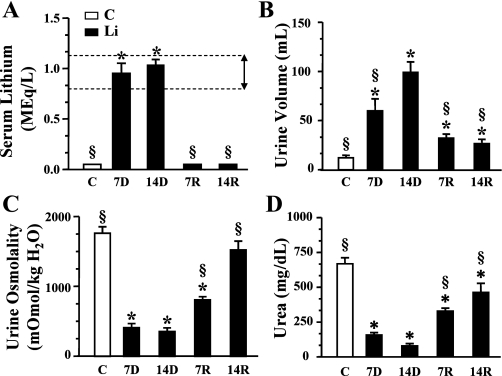
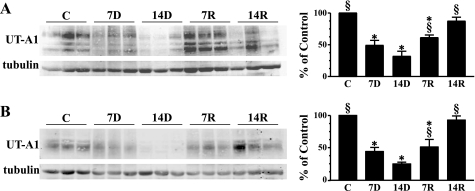
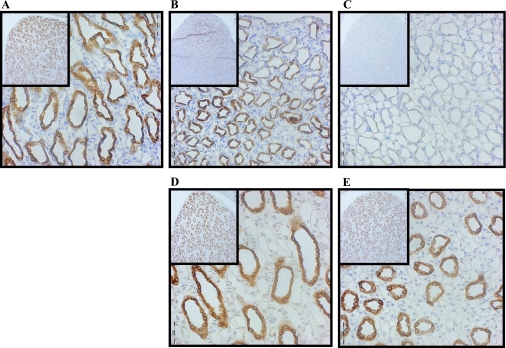
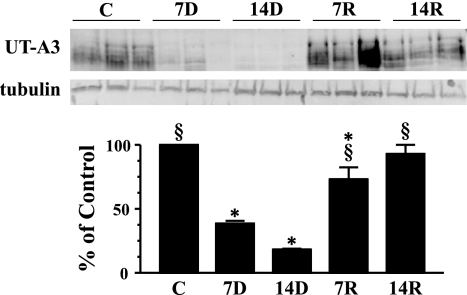
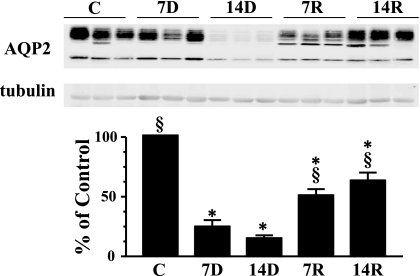
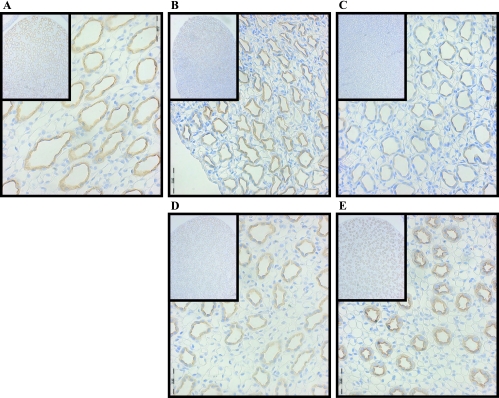
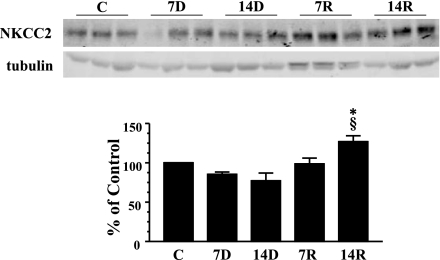
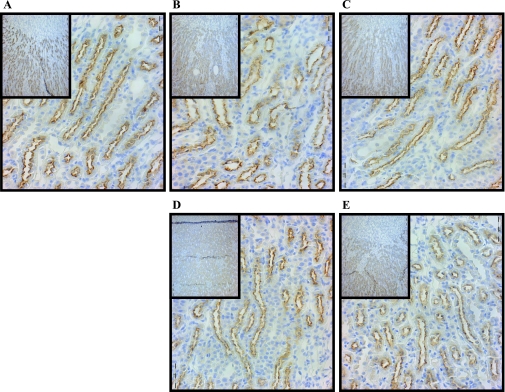
Patients receiving lithium therapy, an effective treatment for bipolar disorder, often present with acquired nephrogenic diabetes insipidus. The nephrotoxic effects of lithium can be detected 3 wk after the start of treatment and many of these symptoms may disappear in a few weeks after lithium use is stopped. Most patients, however, still have a urine-concentrating defect years after ending treatment. This prompted an investigation of the transporters involved in the urine concentration mechanism, UT-A1, UT-A3, aquaporin-2 (AQP2), and NKCC2, after discontinuing lithium therapy. Sprague-Dawley rats fed a Li2CO3-supplemented diet produced large volumes of dilute urine after 14 days. After lithium treatment was discontinued, urine osmolality returned to normal within 14 days but urine volume and urine urea failed to reach basal levels. Western blot and immunohistochemical analyses revealed that both urea transporters UT-A1 and UT-A3 were reduced at 7 and 14 days of lithium treatment and both transporters recovered to basal levels 14 days after discontinuing lithium administration. Similar analyses demonstrated a decrease in AQP2 expression after 7 and 14 days of lithium therapy. AQP2 expression increased over the 7 and 14 days following the cessation of lithium but failed to recover to normal levels. NKCC2 expression was unaltered during the 14-day lithium regimen but did increase 14 days after the treatment was stopped. In summary, the rapid restoration of UT-A1 and UT-A3 as well as the increased expression of NKCC2 are critical components to the reestablishment of urine concentration after lithium treatment.


Figures

Fig. 1.
Fig. 1.
In vivo parameters. Control and lithium-treated rat values presented as bar graphs giving means ± SE. Open bars represent control animals and filled bars are lithium-treated rats. C, control untreated animals; 7D, 7-day lithium treatment; 14D, 14-day lithium treatment; 7R, 7-day refeeding normal chow; 14R, 14 days of refeeding. N = 12 rats/group. *P < 0.05 vs. controls. §P < 0.05 vs. 14D. A: plasma Li levels in control vs. Li-treated animals. The horizontal dashed lines represent the theraputic range of lithium found in human patients undergoing lithium therapy (marked with a double headed arrow). B: 24-h urine volumes for each group of rats. C: urine osmolality for each group of rats. D: urine urea nitrogen for each group of rats.
Fig. 2.
Fig. 2.
Western blot analysis of UT-A1 in inner medulla (IM) tip and IM base. A: provided are 3 representative samples of IM tip lysates from each lithium treatment/recovery group. C, 7D, 14D, 7R, and 14R represent the same experimental groups defined in Fig. 1. Western blots were imaged and analyzed using a LI-COR Odyssey infrared imaging system (LI-COR Biosciences). The bar graph represents densitometry values calculated based on tubulin-loading controls that have been normalized to percent of control. Values are SE from each experimental group where n = 12. B: Western blot of IM base lysates and bar graph; n = 12/experimental group and n = 6/control group. *P < 0.05 vs. controls. §P < 0.05 vs. 14D.
Fig. 3.
Fig. 3.
Immunohistochemistry of UT-A1 after lithium feeding and recovery. Shown are ×40 magnification micrographs of IM sections of 3-mm kidney slices stained with primary antibody against UT-A1 and horseradish peroxidase (HRP)-linked secondary antibody (brown). Nuclei were counterstained with hematoxylin (blue). Insets are ×10 magnifications of the same slices showing overall distribution of the protein in the IM. All micrographs were matched for exposure. A: control. B: 7-day lithium fed. C: 14-day lithium fed. D: 7-day postlithium feeding. E: 14-day postlithium feeding.
Fig. 4.
Fig. 4.
Western blot analysis of UT-A3 in IM tip. Provided are 3 representative samples of IM tip lysates. C, 7D, 14D, 7R, and 14R represent the same experimental groups defined in Fig. 1. The bar graph represents densitometry values calculated based on tubulin-loading controls that have been normalized to percent of control. Values are SE from each experimental group where n = 12. *P < 0.05 vs. controls. §P < 0.05 vs. 14D.
Fig. 5.
Fig. 5.
Western blot analysis of aquaporin-2 (AQP2) in IM tip. Provided are 3 representative samples of IM tip lysates. C, 7D, 14D, 7R, and 14R represent the same experimental groups defined in Fig. 1. The bar graph represents densitometry values calculated based on tubulin-loading controls that have been normalized to percent of control. Values are SE from each experimental group where n = 12. *P < 0.05 vs. controls. §P < 0.05 vs. 14D.
Fig. 6.
Fig. 6.
Immunohistochemistry of AQP2 after lithium feeding and recovery. Shown are ×40 magnification micrographs of IM sections of 3-mm kidney slices stained with primary antibody against AQP2 and HRP-linked secondary antibody (brown). Nuclei were counterstained with hematoxylin (blue). Insets are ×10 magnifications of the same slices showing overall distribution of the protein in the IM. All micrographs were matched for exposure. A: control. B: 7D. C: 14D. D: 7-day postlithium feeding. E: 14-day postlithium feeding.
Fig. 7.
Fig. 7.
Western blot analysis of NKCC2 in outer medulla (OM). Provided are 3 representative samples of IM tip lysates. C, 7D, 14D, 7R, and 14R represent the same experimental groups defined in Fig. 1. The bar graph represents densitometry values calculated based on tubulin-loading controls that have been normalized to percent of control. Values are SE from each experimental group where n = 12. *P < 0.05 vs. controls. §P < 0.05 vs. 14D.
Fig. 8.
Fig. 8.
Immunohistochemistry of NKCC2 after lithium feeding and recovery. Shown are ×40 magnification micrographs of OM sections of 3-mm kidney slices stained with primary antibody against NKCC2 and HRP-linked secondary antibody (brown). Nuclei were counterstained with hematoxylin (blue). Insets are ×10 magnifications of the same slices showing overall distribution of the protein in the IM. All micrographs were matched for exposure. A: control. B: 7D. C: 14D. D: 7-day postlithium feeding. E: 14-day postlithium feeding.

Similar articles

Cited by

References

    1. Anai H, Ueta Y, Serino R, Nomura M, Kabashima N, Shibuya I, Takasugi M, Nakashima Y, Yamashita H. Upregulation of the expression of vasopressin gene in the paraventricular and supraoptic nuclei of the lithium-induced diabetes insipidus rat. Brain Res 772: 161–166, 1997 - PubMed
    1. Bedford JJ, Leader JP, Jing R, Walker LJ, Klein JD, Sands JM, Walker RJ. Amiloride restores renal medullary osmolytes in lithium-induced nephrogenic diabetes insipidus. Am J Physiol Renal Physiol 294: F812–F820, 2008 - PubMed
    1. Bichet DG. Nephrogenic diabetes insipidus. Am J Med 105: 431–442, 1998 - PubMed
    1. Blount MA, Klein JD, Martin CF, Tchapyjnikov D, Sands JM. Forskolin stimulates phosphorylation and membrane accumulation of UT-A3. Am J Physiol Renal Physiol 293: F1308–F1313, 2007 - PubMed
    1. Blount MA, Mistry AC, Frohlich O, Price SR, Chen G, Sands JM, Klein JD. Phosphorylation of UT-A1 urea transporter at serines 486 and 499 is important for vasopressin-regulated activity and membrane accumulation. Am J Physiol Renal Physiol 295: F295–F299, 2008 - PMC - PubMed

Publication types

MeSH terms

LinkOut - more resources