. 2010 Jan;254(1):277-84.
doi: 10.1148/radiol.09082134.

Characterization of metabolic differences between benign and malignant tumors: high-spectral-resolution diffuse optical spectroscopy

Affiliations

Characterization of metabolic differences between benign and malignant tumors: high-spectral-resolution diffuse optical spectroscopy

Shwayta Kukreti et al. Radiology. 2010 Jan.

Abstract

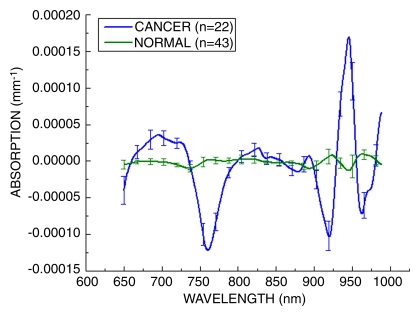
Purpose: To develop a near-infrared spectroscopic method to identify breast cancer biomarkers and to retrospectively determine if benign and malignant breast lesions could be distinguished by using this method.

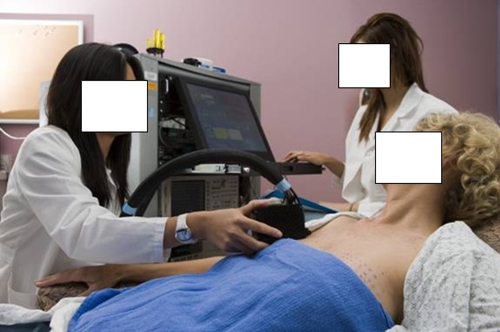
Materials and methods: The study was HIPAA compliant and was approved by the university institutional review board. Written informed consent was obtained. By using self-referencing differential spectroscopy (SRDS) analysis, the existence of specific spectroscopic signatures of breast lesions on images acquired by using diffuse optical spectroscopy imaging in the wavelength range (650-1000 nm) was established. The SRDS method was tested in 60 subjects (mean age, 38 years; age range, 22-74 years). There were 17 patients with benign breast tumors and 22 patients with malignant breast tumors. There were 21 control subjects.

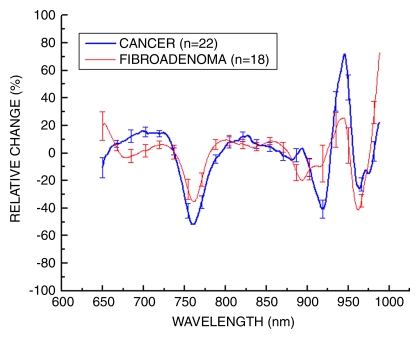
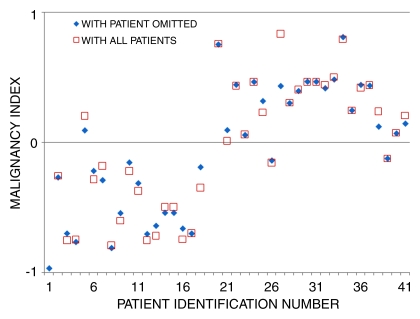
Results: Discrimination analysis helped separate malignant from benign tumors. A total of 40 lesions (22 malignant and 18 benign) were analyzed. Twenty were true-positive lesions, 17 were true-negative lesions, one was a false-positive lesion, and two were false-negative lesions (sensitivity, 91% [20 of 22]; specificity, 94% [17 of 18]; positive predictive value, 95% [20 of 21]; and negative predictive value, 89% [17 of 19]).

Conclusion: The SRDS method revealed localized tumor biomarkers specific to pathologic state.


Figures

Figure 1:
Figure 1:
Laser breast scanner has a handheld probe which is placed in gentle contact with the breast during data acquisition. DOS imaging measurements were obtained in both breasts, point by point over a series of lines marked at 10-mm intervals. For the tumor-containing breast, DOS imaging measurements were taken over tumor and surrounding normal tissues. Similar measurements were taken on the mirrored location of the contralateral breast.
Figure 2:
Figure 2:
Tissue-absorber basis spectra set used to describe the major tissue components in the breast (hemoglobin, water, and bulk lipids). HHb = deoxyhemoglobin, O2Hb = oxyhemoglobin.
Figure 3:
Figure 3:
Average of absorption spectra obtained at 11 spatial locations averaged along a line for malignant and normal breast tissues. Experimental absorption data were fit by using a linear combination of the basis spectra (oxyhemoglobin, deoxyhemoglobin, bulk lipid, and water).
Figure 4:
Figure 4:
STC index–based image for malignant tumor (11 × 13 mm). DOS imaging–mapped regions of the breast are superimposed onto a breast picture. Vertical boxes indicate a subset of the region of interest corresponding to the spectra below. Dots on the image indicate locations at which DOS imaging measurements were obtained. SRDS spectra are shown in two regions: malignant tissue (left) and normal tissue (right). Note that the STC absorption spectrum is found only in the tumor-containing region and not in the surrounding normal tissue. Thus, the STC spectra were spatially localized.
Figure 5:
Figure 5:
Average STC spectra for 22 malignant tumors and 43 normal tissue regions (21 control subjects, 22 patients with malignant tumors). These spectra have been amplitude normalized. Normal and malignant spectra show discernable and repeatable differences by using the SRDS method. Error bars = distribution of the population.
Figure 6:
Figure 6:
Average STC spectra for 22 malignant tumors and 18 benign lesions. These spectra have been amplitude normalized. Benign and malignant spectra show discernable and repeatable differences by using the SRDS method. Error bars = distribution of the population.
Figure 7:
Figure 7:
Separation of benign and malignant tumors by using malignancy index. Malignancy index maximizes differences in wavelength regions of STC spectra to separate benign from malignant tumor types. □ = malignancy index for the set using all patients. ♦ = malignancy index for the patients in the round-robin test. Details of the algorithm are given in Appendix E1 (online).

References

    1. Gribbestad IS, Sitter B, Lundgren S, Krane J, Axelson D. Metabolite composition in breast tumors examined by proton nuclear magnetic resonance spectroscopy. Anticancer Res 1999;19:1737–1746 - PubMed
    1. Roebuck JR, Cecil KM, Schnall MD, Lenkinski RE. Human breast lesions: characterization with proton MR spectroscopy. Radiology 1998;209:269–275 - PubMed
    1. Kvistad KA, Bakken IJ, Gribbestad IS, et al. Characterization of neoplastic and normal human breast tissues with in vivo (1)H MR spectroscopy. J Magn Reson Imaging 1999;10:159–164 - PubMed
    1. Jagannathan NR, Kumar M, Seenu V, et al. Evaluation of total choline from in-vivo volume localized proton MR spectroscopy and its response to neoadjuvant chemotherapy in locally advanced breast cancer. Br J Cancer 2001;84:1016–1022 - PMC - PubMed
    1. Yeung DK, Chan Y, Leung S, Poon PM, Pang C. Detection of an intense resonance at 2.4 ppm in 1H MR spectra of patients with severe late-delayed, radiation-induced brain injuries. Magn Reson Med 2001;45:994–1000 - PubMed

Publication types

Substances