

Natural and artificial RNAs occupy the same restricted region of sequence space
- PMID: 20032164
- PMCID: PMC2811657
- DOI: 10.1261/rna.1923210
Natural and artificial RNAs occupy the same restricted region of sequence space
Abstract
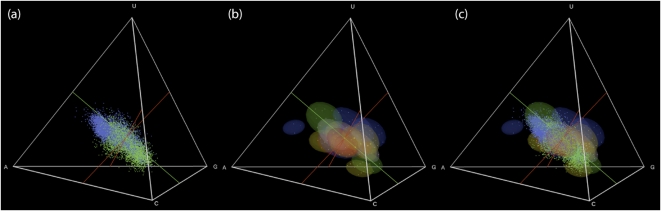
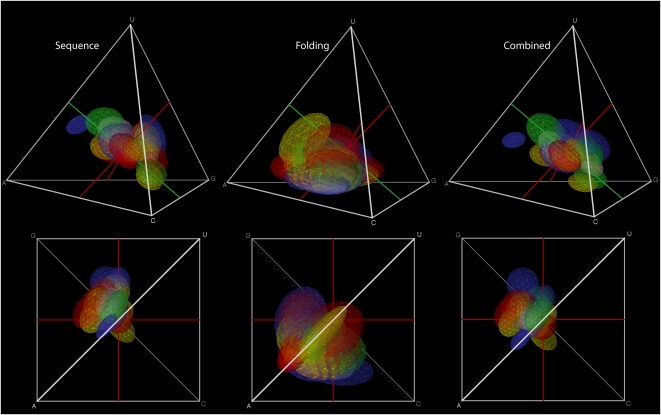
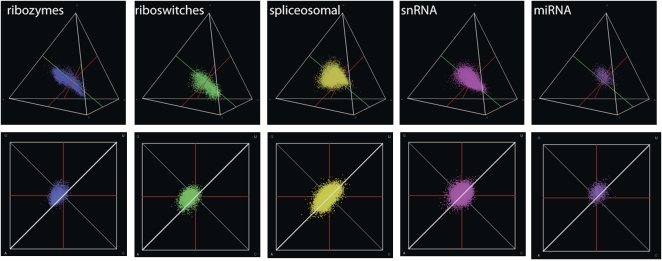
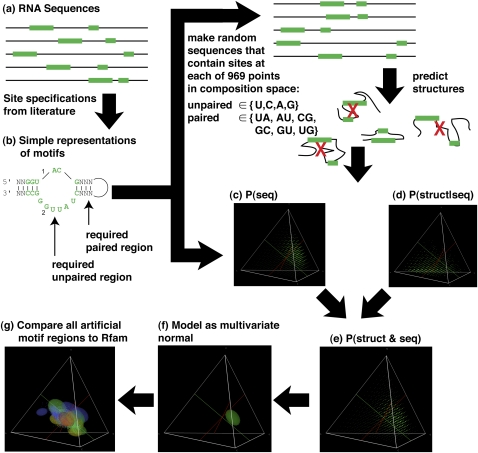
Different chemical and mutational processes within genomes give rise to sequences with different compositions and perhaps different capacities for evolution. The evolution of functional RNAs may occur on a "neutral network" in which sequences with any given function can easily mutate to sequences with any other. This neutral network hypothesis is more likely if there is a particular region of composition that contains sequences that are functional in general, and if many different functions are possible within this preferred region of composition. We show that sequence preferences in active sites recovered by in vitro selection combine with biophysical folding rules to support the neutral network hypothesis. These simple active-site specifications and folding preferences obtained by artificial selection experiments recapture the previously observed purine bias and specific spread along the GC axis of naturally occurring aptamers and ribozymes isolated from organisms, although other types of RNAs, such as miRNA precursors and spliceosomal RNAs, that act primarily through complementarity to other amino acids do not share these preferences. These universal evolved sequence features are therefore intrinsic in RNA molecules that bind small-molecule targets or catalyze reactions.
Figures
Similar articles
-
Nucleotides that are essential but not conserved; a sufficient L-tryptophan site in RNA.RNA. 2010 Oct;16(10):1915-24. doi: 10.1261/rna.2220210. Epub 2010 Aug 10. RNA. 2010. PMID: 20699302 Free PMC article.
-
Evolutionary origins and directed evolution of RNA.Int J Biochem Cell Biol. 2009 Feb;41(2):254-65. doi: 10.1016/j.biocel.2008.08.015. Epub 2008 Aug 19. Int J Biochem Cell Biol. 2009. PMID: 18775793 Review.
-
High-Throughput Analysis and Engineering of Ribozymes and Deoxyribozymes by Sequencing.Acc Chem Res. 2020 Dec 15;53(12):2903-2912. doi: 10.1021/acs.accounts.0c00546. Epub 2020 Nov 9. Acc Chem Res. 2020. PMID: 33164502
-
RNA affinity for molecular L-histidine; genetic code origins.J Mol Evol. 2005 Aug;61(2):226-35. doi: 10.1007/s00239-004-0360-9. Epub 2005 Jun 27. J Mol Evol. 2005. PMID: 15999244
-
The structure and function of catalytic RNAs.Sci China C Life Sci. 2009 Mar;52(3):232-44. doi: 10.1007/s11427-009-0038-z. Epub 2009 Mar 18. Sci China C Life Sci. 2009. PMID: 19294348 Review.
Cited by
-
On the emergence of structural complexity in RNA replicators.RNA. 2019 Dec;25(12):1579-1591. doi: 10.1261/rna.070391.119. Epub 2019 Aug 29. RNA. 2019. PMID: 31467146 Free PMC article.
-
RNA regulators responding to ribosomal protein S15 are frequent in sequence space.Nucleic Acids Res. 2016 Nov 2;44(19):9331-9341. doi: 10.1093/nar/gkw754. Epub 2016 Aug 31. Nucleic Acids Res. 2016. PMID: 27580716 Free PMC article.
-
Nucleotides that are essential but not conserved; a sufficient L-tryptophan site in RNA.RNA. 2010 Oct;16(10):1915-24. doi: 10.1261/rna.2220210. Epub 2010 Aug 10. RNA. 2010. PMID: 20699302 Free PMC article.
-
The paradox of dual roles in the RNA world: resolving the conflict between stable folding and templating ability.J Mol Evol. 2013 Sep;77(3):55-63. doi: 10.1007/s00239-013-9584-x. J Mol Evol. 2013. PMID: 24078151 Free PMC article.
-
Type-II tRNAs and Evolution of Translation Systems and the Genetic Code.Int J Mol Sci. 2018 Oct 22;19(10):3275. doi: 10.3390/ijms19103275. Int J Mol Sci. 2018. PMID: 30360357 Free PMC article.
References
-
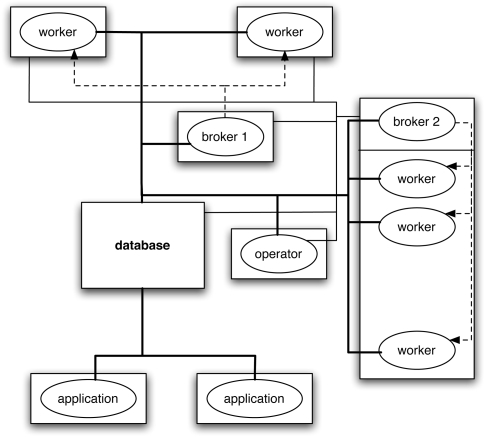
- De Sterck H, Zhang C, Papo A. Database-driven grid computing with GridBASE. IEEE International Symposium on Bioinformatics and Life Science Computing (BLSC07), AINAW-07; IEEE Computer Society; Washington, DC. 2007. pp. 696–701.
-
- De Sterck H, Papo A, Zhang C, Hamady M, Knight R. Database-driven grid computing and distributed web applications: A comparison. In: Zomaya A, Taibi E-G, editors. Grids for bioinformatics and computational biology. Wiley Interscience; New York: 2008. pp. 247–266.
-
- Durrett R. Probability theory and examples. 3rd ed. Duxbury Press; Pacific Grove, CA: 2004.
Publication types
MeSH terms
Substances
Grants and funding
LinkOut - more resources
Full Text Sources
Miscellaneous