. 2010 Mar;84(5):2533-46.
doi: 10.1128/JVI.01909-09. Epub 2009 Dec 23.

The latent origin of replication of Epstein-Barr virus directs viral genomes to active regions of the nucleus

Affiliations

The latent origin of replication of Epstein-Barr virus directs viral genomes to active regions of the nucleus

Manuel J Deutsch et al. J Virol. 2010 Mar.

Abstract

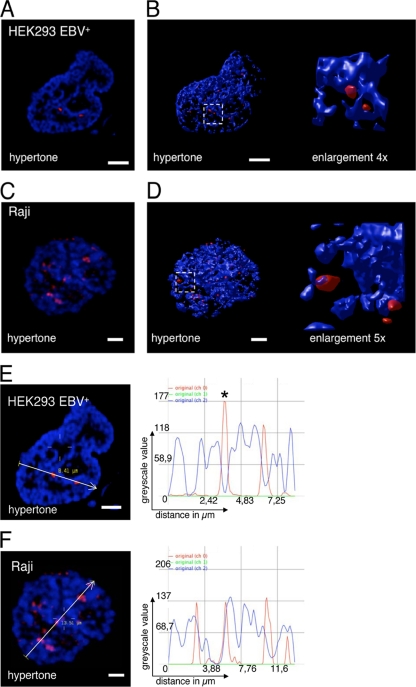
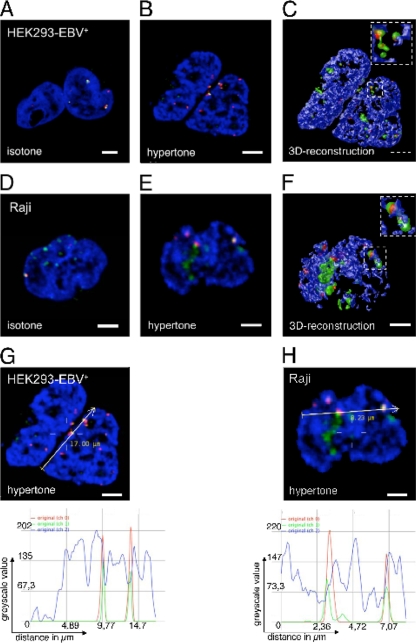
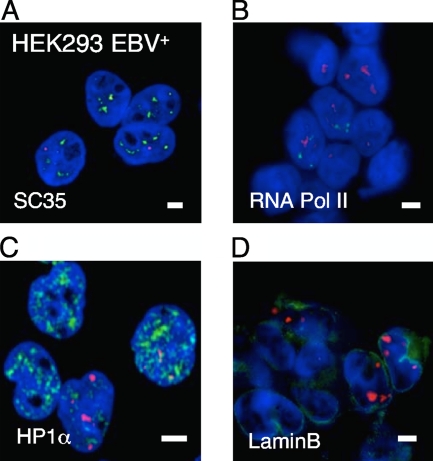
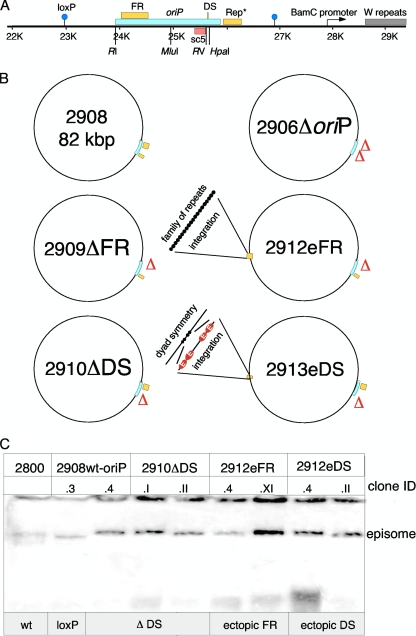
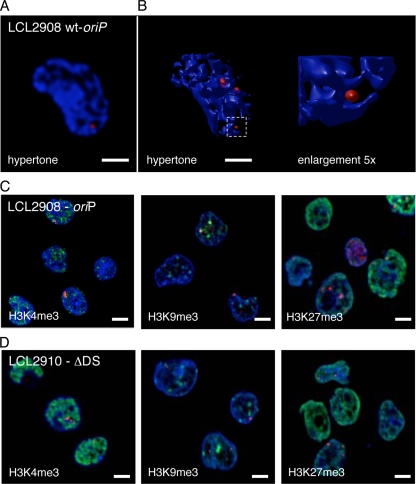
The Epstein-Barr virus efficiently infects human B cells. The EBV genome is maintained extrachromosomally and replicates synchronously with the host's chromosomes. The latent origin of replication (oriP) guarantees plasmid stability by mediating two basic functions: replication and segregation of the viral genome. While the segregation process of EBV genomes is well understood, little is known about its chromatin association and nuclear distribution during interphase. Here, we analyzed the nuclear localization of EBV genomes and the role of functional oriP domains FR and DS for basic functions such as the transformation of primary cells, their role in targeting EBV genomes to distinct nuclear regions, and their association with epigenetic domains. Fluorescence in situ hybridization visualized the localization of extrachromosomal EBV genomes in the regions adjacent to chromatin-dense territories called the perichromatin. Further, immunofluorescence experiments demonstrated a preference of the viral genome for histone 3 lysine 4-trimethylated (H3K4me3) and histone 3 lysine 9-acetylated (H3K9ac) nuclear regions. To determine the role of FR and DS for establishment and subnuclear localization of EBV genomes, we transformed primary human B lymphocytes with recombinant mini-EBV genomes containing different oriP mutants. The loss of DS results in a slightly increased association in H3K27me3 domains. This study demonstrates that EBV genomes or oriP-based extrachromosomal vector systems are integrated into the higher order nuclear organization. We found that viral genomes are not randomly distributed in the nucleus. FR but not DS is crucial for the localization of EBV in perichromatic regions that are enriched for H3K4me3 and H3K9ac, which are hallmarks of transcriptionally active regions.


Figures

FIG. 1.
FIG. 1.
EBV episomes are localized in perichromatic regions of the nucleus. Immuno-FISH image of HEK293-EBV+ (A) and Raji (C) cells displaying a DAPI DNA counterstain (blue; channel 2) and a fluorescence in situ hybridization of EBV genomic DNA (red). 3D reconstruction of HEK293-EBV+ (B) and Raji (D) treated with hypertonic buffer with an enlarged section. EBV DNA is detected near the condensed chromatin, which defines the perichromatic localization. EBV DNA neither colocalizes with the chromatic domain nor exists unassociated with the chromatin. Enlargements are indicated by white-lined squares. 3D reconstructions were used to quantify the perichromatic localization of EBV genomes. Scale bar = 2 μm. Signal intensity scans for EBV (red; channel 0) and DNA counterstain (blue; channel 1) along the indicated line and direction in HEK293-EBV+ (E) and Raji (F) confirm the perichromatic localization. Localization of EBV is not observed in the peaks of the DNA counterstain but is observed in the shoulders of DAPI-stained regions. Line scans represent one selected confocal plane, which might result in unambiguous results. The asterisk indicates a signal that seems unassociated in this particular confocal plane but is clearly associated in an adjacent plane. See also Fig. S2 in the supplemental material for details. Scale bar = 2 μm.
FIG. 2.
FIG. 2.
EBV and EBNA1 colocalize in perichromatic regions. (A to C) HEK293-EBV+ cells stained for EBV genomic DNA (red), EBNA1 (green), and DNA (blue) by combinational immunofluorescence and fluorescence in situ hybridization. EBV and EBNA1 colocalize in regions adjacent to condensed chromatin domains of the nucleus. This perichromatic localization is revealed by the hypertonic treatment (B) and 3D reconstruction (C). Scale bar = 2 μm. (D to F) Raji cells after combined immunofluorescence and fluorescence in situ hybridization. EBV genomic DNA (red), EBNA1, (green) and DNA (blue); EBV and EBNA1 colocalize in perichromatic regions of the nucleus. The perichromatic localization is obvious after hypertonic treatment (E) and 3D reconstruction (F). Enlargements are indicated by white-lined squares. Scale bar = 2 μm. (G) Signal intensity scan of EBNA1 (green; channel 1 of the microscope), EBV (red; channel 0), and DNA counterstain (blue; channel 2) along the indicated line in HEK293-EBV+ cells. EBV peaks colocalize with peaks for EBNA1. Colocalization does not occur in the peaks of the DNA counterstain but next to it, indicating perichromatic localization. (H) Signal intensity scans for EBNA1 (green), EBV (red), and DNA counterstain (blue) along the indicated line in Raji cells. EBV peaks colocalize with peaks for EBNA1. Scale bar = 2 μm.
FIG. 3.
FIG. 3.
Localization of EBV genomes in subnuclear compartments of interphase nuclei. HEK293-EBV+ cells were fixed and FISH was used to visualize the viral genome with an EBV-specific probe. The DNA was counterstained with DAPI. A potential colocalization with different subnuclear markers was analyzed with IF techniques. (A) Immunofluorescence image for the splicing protein SC35 (red), EBV genomes (green), and DNA counterstain (blue) in HEK293-EBV+ cells. EBV and SC35 signals show no significant colocalization. (B) Immunofluorescence image for RNA-Pol II (red), EBV genomes (green), and DNA counterstain (blue) in HEK293-EBV+ cells. EBV and RNA-Pol II signals show no significant colocalization. (C) No specific colocalization of EBV DNA with the heterochromatin protein HP1α (red) was observed. (D) A potential colocalization of EBV with the nuclear meshwork was determined with a LaminB1-specific antibody (red). Scale bar = 2 μm.
FIG. 4.
FIG. 4.
EBV genomes associate with specific histone modifications. The localization of different EBV genomes in epigenetic regions was determined with a combination of immunofluorescence techniques. The EBV genome of Raji cells (A) and an LCL transformed with a full-length EBV genome (B) were visualized by FISH using an EBV-specific probe (red). Colocalization with histone 3 trimethylated at lysine 4 (H3K4me3; first panel), histone 3 trimethylated at lysine 9 (H3K9me3; second panel), histone 3 trimethylated at lysine 27 (H3K27me3; third panel), and histone 3 acetylated at lysine 9 (H3K9ac; fourth panel) is shown in green. 3D reconstructions of the Raji cells are shown in Fig. S3 in the supplemental material. Scale bar = 2 μm. (For signal intensity scans of panel A, see Fig. S3 in the supplemental material). (C) ChIP experiments of HEK293 cells transfected with wild-type oriP. Cells were cross-linked for 8 min at room temperature with 1% formaldehyde. Sonicated chromatin (200 μg) was immunoprecipitated with 2.5 μg of the indicated antibody. Coprecipitated DNA was analyzed with oriP-, oriLyt-, and Q-promoter specific primer pairs as described previously (45) and quantified in relation to the amount of the input chromatin (y axis).
FIG. 5.
FIG. 5.
Maps of mini-EBV plasmids. (A) The latent origin, schematically shown at the top, is flanked by loxP sites (blue circles) for cloning purposes. The minimal oriP encompasses the family of repeats (FR) and the dyad symmetry element (DS). Rep* is a 298-bp fragment that can partially replace the DS element if multimerized on a plasmid (28). The oriP-specific PCR fragment sc5 (red box) was utilized for quantification experiments. The restriction enzymes used for the deletion of FR (EcoRI [RI] and MluI) and DS (EcoRV [RV] and HpaI) are indicated at their respective positions. (B) Different oriP mutants were generated in the context of the mini-EBV genome and used for immortalization experiments. Depicted are oriP (blue box) and its two functional elements DS and FR (yellow boxes). Starting from p2908, three deletion mutants were generated: p2910ΔDS is lacking DS, p2909ΔFR is lacking the family of repeats, and p2906ΔoriP is lacking the entire oriP, including the auxiliary element Rep*. p2913eDS and p2912eFR carrying the respective oriP element integrated at an ectopic site, positioned 35 kbp apart from the oriP locus. (C) The Gardella gel technique was used to determine the episomal status of LCL subclones containing the different mini-EBV mutants (17). 2800 is identical to the basic mini-EBV p1478. A but lacking the neomycin resistance marker (25, 26). 2908 carries a wild-type oriP that is flanked by loxP sites used for the generation of 2912eFR and 2913eDS. 2 × 10⁶ to 5 × 10⁶ cells of each individual cell clone were lysed in the wells of a Gardella gel and probed with a radiolabeled plasmid recognizing the prokaryotic backbone of the mini-EBV genomes and oriP (17). Two clones of each established LCL were analyzed (clone ID).
FIG. 6.
FIG. 6.
Integrity of oriP affects copy number. (A) The different mini-EBV mutants were analyzed by the Gardella gel technique in order to confirm the episomal status of the viral genomes 6 months posttransfection. Quantitative PCR and Southern blotting determined the copy numbers of the different mini-EBV variants. For Gardella gel analysis, the indicated amount of cells was lysed for the individual lanes (×105 cells). Two different amounts of Raji cells were included for standardization, resulting in 10 × 106 and 30 × 106 EBV genomes, respectively (51). We used an oriP-bearing plasmid as a hybridization probe that recognizes the prokaryotic backbone of the mini-EBV genomes as well as oriP fragments. The copy numbers of the different mutants were determined using the AIDA Image Analyser software (Raytest) (third row). The resulting absolute copy number is given in row two. In parallel, the copy number was revealed by quantitative PCR generating a standard curve from a series of 10-fold dilutions from purified mini-EBV genomes (row four). The mean values and standard deviations of results of three independent experiments are shown in row five (copies/cell; Q-PCR). (B) Examples of FISH experiments that indicate different populations in the 2908wt-oriP and 2910ΔDS cell lines. 3D stacks of fluorescence images were projected according to the maximum intensity of the acquired volume pixels along the z axis. 2908wt-oriP cells showed an average of 5.5 and 12.4 signals per cell. 2910ΔDS cells illustrated an average of 1.8 and 5.5 signals per cell. Scale bar = 2 μm. The data are summarized in Table 3.
FIG. 7.
FIG. 7.
The integrity of oriP does not alter the nuclear localization of mini-EBV genomes. (A) Immuno-FISH image of LCL2908wt-oriP cells displaying a DAPI DNA counterstain (blue) and a fluorescence in situ hybridization of EBV genomic DNA (red). (B) 3D-reconstruction LCL2908wt-oriP cells treated with hypertonic buffer. The enlargement depicts the area outlined by the white square. Mini-EBV DNA is detected near the condensed chromatin, which defines the perichromatic localization. Mini-EBV DNA neither colocalizes with the chromatic domain nor exists unassociated with the chromatin. Enlargements are indicated by the white-lined square. (For signal intensity scans of panel A, see Fig. S2 in the supplemental material). The mini-EBV genome p2908 (C) or the mini-EBV genome lacking DS (D) were visualized by FISH using an EBV-specific probe (red). Colocalization with histone 3 trimethylated at lysine 4 (H3K4me3; first panel), histone 3 trimethylated at lysine 9 (H2H9me3; second panel), and histone 3 trimethylated at lysine 27 (H3K27me3; third panel) are shown in green. Scale bar = 2 μm. (For signal intensity scans of panels C and D) see Fig. S6 in the supplemental material).

Similar articles

Cited by

References

    1. Albiez, H., M. Cremer, C. Tiberi, L. Vecchio, L. Schermelleh, et al. 2006. Chromatin domains and the interchromatin compartment form structurally defined and functionally interacting nuclear networks. Chromosome Res. 14:707-733. - PubMed
    1. Bolte, S., and F. P. Cordelieres. 2006. A guided tour into subcellular colocalization analysis in light microscopy. J. Microsc. 224:213-232. - PubMed
    1. Branco, M. R., and A. Pombo. 2006. Intermingling of chromosome territories in interphase suggests role in translocations and transcription-dependent associations. PLoS Biol. 4:e138. - PMC - PubMed
    1. Chambeyron, S., and W. A. Bickmore. 2004. Chromatin decondensation and nuclear reorganization of the HoxB locus upon induction of transcription. Genes Dev. 18:1119-1130. - PMC - PubMed
    1. Chaudhuri, B., H. Xu, I. Todorov, A. Dutta, and J. L. Yates. 2001. Human DNA replication initiation factors, ORC and MCM, associate with oriP of Epstein-Barr virus. Proc. Natl. Acad. Sci. U. S. A. 98:10085-10089. - PMC - PubMed

Publication types

MeSH terms

LinkOut - more resources