. 2010 Mar;332(3):866-75.
doi: 10.1124/jpet.109.163774. Epub 2009 Dec 23.

Seventy-five percent nephrectomy and the disposition of inorganic mercury in 2,3-dimercaptopropanesulfonic acid-treated rats lacking functional multidrug-resistance protein 2

Affiliations

Seventy-five percent nephrectomy and the disposition of inorganic mercury in 2,3-dimercaptopropanesulfonic acid-treated rats lacking functional multidrug-resistance protein 2

Rudolfs K Zalups et al. J Pharmacol Exp Ther. 2010 Mar.

Abstract

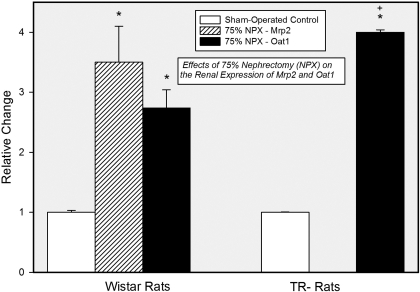
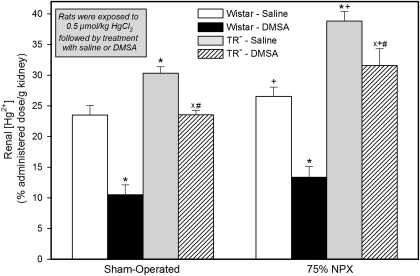
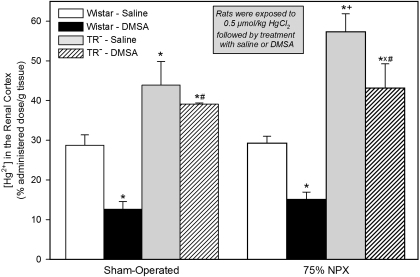
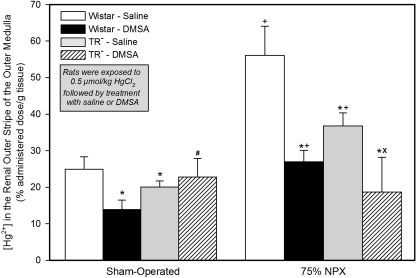
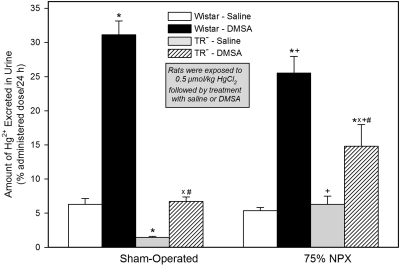
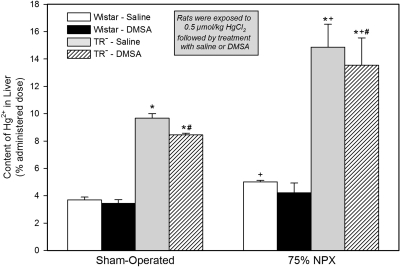
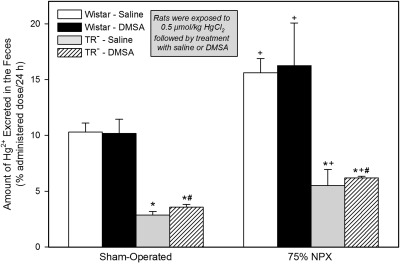
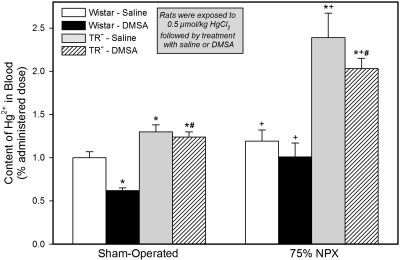
In the present study, we evaluated the disposition of inorganic mercury (Hg(2+)) in sham-operated and 75% nephrectomized (NPX) Wistar and transport-deficient (TR(-)) rats treated with saline or the chelating agent meso-2,3-dimercaptosuccinic acid (DMSA). Based on previous studies, DMSA and TR(-) rats were used as tools to examine the potential role of multidrug-resistance protein 2 (MRP2) in the disposition of Hg(2+) during renal insufficiency. All animals were treated with a low dose (0.5 mumol/kg i.v.) of mercuric chloride (HgCl(2)). At 24 and 28 h after exposure to HgCl(2), matched groups of Wistar and TR(-) rats received normal saline or DMSA (intraperitoneally). Forty-eight hours after exposure to HgCl(2), the disposition of Hg(2+) was examined. A particularly notable effect of 75% nephrectomy in both strains of rats was enhanced renal accumulation of Hg(2+), specifically in the outer stripe of the outer medulla. In addition, hepatic accumulation, fecal excretion, and blood levels of Hg(2+) were enhanced in rats after 75% nephrectomy, especially in the TR(-) rats. Treatment with DMSA increased both the renal tubular elimination and urinary excretion of Hg(2+) in all rats. DMSA did not, however, affect hepatic content of Hg(2+), even in the 75% NPX TR(-) rats. We also show with real-time polymerase chain reaction that after 75% nephrectomy and compensatory renal growth, expression of MRP2 (only in Wistar rats) and organic anion transporter 1 is enhanced in the remaining functional proximal tubules. We conclude that MRP2 plays a significant role in the renal and corporal disposition of Hg(2+) after a 75% reduction of renal mass.


Figures

Fig. 1.
Fig. 1.
Results from real-time PCR analyses of the expression of Mrp2 and Oat1 in samples of combined renal cortex and outer stripe of the outer medulla from SO and 75% NPX Wistar and TR rats 14 days after surgery. ∗ indicates significantly different (p < 0.05) from corresponding control. + indicates significantly different (p < 0.05) from the corresponding mean obtained from Wistar rats.
Fig. 2.
Fig. 2.
Renal concentration of Hg2+ in SO and 75% NPX Wistar and TR rats, treated with an intraperitoneal 100 mg/kg dose of DMSA or saline 24 and 28 h after being injected intravenously with a 0.5 μmol/kg dose of mercuric chloride. Animals were sacrificed 48 h after being injected with Hg2+. Each value represents the mean ± S.E. from four animals. ∗ indicates significantly different (p < 0.05) from the corresponding group of Wistar rats treated with saline. X indicates significantly different (p < 0.05) from the corresponding group of TR rats treated with saline. # indicates significantly different (p < 0.05) from the corresponding group of Wistar rats treated with DMSA. + indicates significantly different (p < 0.05) from the corresponding group of SO rats treated in the same manner.
Fig. 3.
Fig. 3.
Concentration of Hg2+ in the renal cortex of SO and 75% NPX Wistar and TR rats, treated with an intraperitoneal 100 mg/kg dose of DMSA or saline 24 and 28 h after being injected intravenously with a 0.5 μmol/kg dose of mercuric chloride. Animals were sacrificed 48 h after being injected with Hg2+. Each value represents the mean ± S.E. from four animals. ∗ indicates significantly different (p < 0.05) from the corresponding group of Wistar rats treated with saline. X indicates significantly different (p < 0.05) from the corresponding group of TR rats treated with saline. # indicates significantly different (p < 0.05) from the corresponding group of Wistar rats treated with DMSA. + indicates significantly different (p < 0.05) from the corresponding group of SO rats treated in the same manner.
Fig. 4.
Fig. 4.
Concentration of Hg2+ in the renal outer stripe of the outer medulla of SO and 75% NPX Wistar and TR rats, treated with an intraperitoneal 100 mg/kg dose of DMSA or saline 24 and 28 h after being injected intravenously with a 0.5 μmol/kg dose of mercuric chloride. Animals were sacrificed 48 h after being injected with Hg2+. Each value represents the mean ± S.E. from four animals. ∗ indicates significantly different (p < 0.05) from the corresponding group of Wistar rats treated with saline. X indicates significantly different (p < 0.05) from the corresponding group of TR rats treated with saline. # indicates significantly different (p < 0.05) from the corresponding group of Wistar rats treated with DMSA. + indicates significantly different (p < 0.05) from the corresponding group of SO rats treated in the same manner.
Fig. 5.
Fig. 5.
Amount of Hg2+ excreted in the urine in 24 h by SO and 75% NPX Wistar and TR rats treated with an intraperitoneal 100 mg/kg dose of DMSA or saline 24 and 28 h after being injected intravenously with a 0.5 μmol/kg dose of mercuric chloride. Animals were sacrificed 48 h after being injected with Hg2+. Each value represents the mean ± S.E. from four animals. ∗ indicates significantly different (p < 0.05) from the corresponding group of Wistar rats treated with saline. X indicates significantly different (p < 0.05) from the corresponding group of TR rats treated with saline. # indicates significantly different (p < 0.05) from the corresponding group of Wistar rats treated with DMSA. + indicates significantly different (p < 0.05) from the corresponding group of SO rats treated in the same manner.
Fig. 6.
Fig. 6.
Hepatic content of Hg2+ in SO and 75% NPX Wistar and TR rats treated with an intraperitoneal 100 mg/kg dose of DMSA or saline 24 and 28 h after being injected intravenously with a 0.5 μmol/kg dose of mercuric chloride. Animals were sacrificed 48 h after being injected with Hg2+. Each value represents the mean ± S.E. from four animals. ∗ indicates significantly different (p < 0.05) from the corresponding group of Wistar rats treated with saline. # indicates significantly different (p < 0.05) from the corresponding group of Wistar rats treated with DMSA. + indicates significantly different (p < 0.05) from the corresponding group of SO rats treated in the same manner.
Fig. 7.
Fig. 7.
Amount of Hg2+ excreted in the feces in 24 h by SO and 75% NPX Wistar and TR rats treated with an intraperitoneal 100 mg/kg dose of DMSA or saline 24 and 28 h after being injected intravenously with a 0.5 μmol/kg dose of mercuric chloride. Animals were sacrificed 48 h after being injected with Hg2+. Each value represents the mean ± S.E. from four animals. ∗ indicates significantly different (p < 0.05) from the corresponding group of Wistar rats treated with saline. # indicates significantly different (p < 0.05) from the corresponding group of Wistar rats treated with DMSA. + indicates significantly different (p < 0.05) from the corresponding group of SO rats treated in the same manner.
Fig. 8.
Fig. 8.
Estimated content of Hg2+ in the total blood volume of SO and 75% NPX Wistar and TR rats treated with an intraperitoneal 100 mg/kg dose of DMSA or saline 24 and 28 h after being injected intravenously with a 0.5 μmol/kg dose of mercuric chloride. Animals were sacrificed 48 h after being injected with Hg2+. Blood volume was estimated to be 6% of body weight. Each value represents the mean ± S.E. from four animals. ∗ indicates significantly different (p < 0.05) from the corresponding group of Wistar rats treated with saline. # indicates significantly different (p < 0.05) from the corresponding group of Wistar rats treated with DMSA. + indicates significantly different (p < 0.05) from the corresponding group of SO rats treated in the same manner.

Similar articles

Cited by

References

    1. Amaral JS, Pinho MJ, Soares-da-Silva P. (2009) Regulation of amino acid transporters in the rat remnant kidney. Nephrol Dial Transplant 24:2058–2067 - PubMed
    1. Aslamkhan AG, Han YH, Yang XP, Zalups RK, Pritchard JB. (2003) Human renal organic anion transporter 1-dependent uptake and toxicity of mercuric-thiol conjugates in Madin-Darby canine kidney cells. Mol Pharmacol 63:590–596 - PubMed
    1. Belanger M, Westin A, Barfuss DW. (2001) Some health physics aspects of working with 203Hg in university research. Health Phys 80 (Suppl 1):S29–S30 - PubMed
    1. Bridges CC, Bauch C, Verrey F, Zalups RK. (2004) Mercuric conjugates of cysteine are transported by the amino acid transporter system b(0,+): implications of molecular mimicry. J Am Soc Nephrol 15:663–673 - PMC - PubMed
    1. Bridges CC, Joshee L, Zalups RK. (2008a) MRP2 and the DMPS- and DMSA-mediated elimination of mercury in TR− and control rats exposed to thiol S-conjugates of inorganic mercury. Toxicol Sci 105:211–220 - PMC - PubMed

Publication types

MeSH terms

Substances

LinkOut - more resources