. 2010 Mar;103(3):1158-70.
doi: 10.1152/jn.00933.2009. Epub 2009 Dec 23.

Responses of amygdala neurons to positive reward-predicting stimuli depend on background reward (contingency) rather than stimulus-reward pairing (contiguity)

Affiliations

Responses of amygdala neurons to positive reward-predicting stimuli depend on background reward (contingency) rather than stimulus-reward pairing (contiguity)

Maria A Bermudez et al. J Neurophysiol. 2010 Mar.

Abstract

Prediction about outcomes constitutes a basic mechanism underlying informed economic decision making. A stimulus constitutes a reward predictor when it provides more information about the reward than the environmental background. Reward prediction can be manipulated in two ways, by varying the reward paired with the stimulus, as done traditionally in neurophysiological studies, and by varying the background reward while holding stimulus-reward pairing constant. Neuronal mechanisms involved in reward prediction should also be sensitive to changes in background reward independently of stimulus-reward pairing. We tested this assumption on a major brain structure involved in reward processing, the central and basolateral amygdala. In a 2 x 2 design, we examined the influence of rewarded and unrewarded backgrounds on neuronal responses to rewarded and unrewarded visual stimuli. Indeed, responses to the unchanged rewarded stimulus depended crucially on background reward in a population of amygdala neurons. Elevating background reward to the level of the rewarded stimulus extinguished these responses, and lowering background reward again reinstated the responses without changes in stimulus-reward pairing. None of these neurons responded specifically to an inhibitory stimulus predicting less reward compared with background (negative contingency). A smaller group of amygdala neurons maintained stimulus responses irrespective of background reward, possibly reflecting stimulus-reward pairing or visual sensory processes without reward prediction. Thus in being sensitive to background reward, the responses of a population of amygdala neurons to phasic stimuli appeared to follow the full criteria for excitatory reward prediction (positive contingency) rather than reflecting simple stimulus-reward pairing (contiguity).


Figures
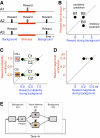
Fig. 1.
Fig. 1.
Experimental design and behavioral task. A: reward occurrence in relation to the 2 main periods in a Pavlovian task, stimulus and background. A1: reward during the stimulus but not the background makes the stimulus a reward predictor. A2: same reward during stimulus and background makes the stimulus uninformative. A3: reward during the background but not the stimulus makes the stimulus a predictor of no reward. B: 2-dimensional plot of stimulus and background rewards. B1–B3: analogous to conditions A1–A3. The diagonal line indicates same reward with stimulus and background, rendering the stimulus uninformative. The drawing follows the contingency scheme from Dickinson (1980). C: background reward probability tests used in the experiment, with constant stimulus and background reward magnitude of 0.4 ml. The 2 × 2 design used 2 stimuli with different reward probabilities (CS+, PS = 0.9, top; CS−, PS = 0.0, bottom) set against 2 background reward probabilities (PB = 0.0, left, and PB = 0.9, right). D: background reward magnitude test, changing from 0.4 ml (right ●) to 0.2 ml (● ←). Stimulus reward had constant probability of PS = 0.9 and constant magnitude of 0.4 ml. E: sequence of task periods and events. For reasons of display, the background was split into 2 epochs that appeared contiguous to the animal (wrap around from right to left). The 2 differently rewarded stimuli (CS+, CS−) alternated pseudorandomly between trials, backgrounds alternated between trial blocks.
Fig. 2.
Fig. 2.
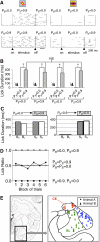
Behavioral performance and recording sites. A: licking behavior. Horizontal lines indicate photobeam interruptions by tongue at liquid spout in each trial. Each line shows 1 trial, trial sequence is from top to bottom, vertical ticks indicate rewards. Licking was higher for reward at probability P = 0.9 than P = 0.0 during stimuli (PS; left vs. right shaded areas) and backgrounds (PB; bottom vs. top). B: median lick durations per 2 s during stimulus and background, acquired during neuronal recordings. Note that lick durations in all unrewarded stimulus and background periods (PS = 0.0 or PB = 0.0) were close to 0 (arrows). *P < 0.0001; Wilcoxon test; NS: P > 0.4; Kruskal-Wallis test. Each bar shows median from 10 blocks of 15 trials each. C: median lick durations per 2 s during background when changing between blocks. Left: background reward increase from PB = 0.0 to PB = 0.9. Right: background reward decrease. BT: licking during background in all trials after transition; B1: licking during background only during 1st trial after transition; ST: licking during stimulus in all trials after transition; S1: licking during stimulus only during 1st trial after transition (15 trial blocks). D: ratios of median lick durations per 2 s between stimuli and backgrounds: LS/LS + LB, where S and B refer to stimulus and background. All lick durations shown in B–D were from consecutive blocks of trials that went unrewarded due to the probabilistic schedules. E: positions of recorded neurons. Left: coronal section of rhesus brain; square indicates medial temporal lobe (Paxinos et al. 2000). Right: Histological reconstruction of background reward-sensitive neurons in animal A with approximate positions for animal B superimposed. CE, central nucleus (red); BL, basolateral nucleus (green); L, lateral nucleus (blue).
Fig. 3.
Fig. 3.
Durations of stimulus responses. Each line indicates the duration of response to onset of the rewarded stimulus (PS = 0.9) in 1 amygdala neuron (unrewarded background) as assessed by the sliding window procedure (see methods). Lines are ordered according to onsets, then durations, and colored according to amygdala subnuclei (red, central nucleus, n = 16 neurons; green, basolateral nucleus, n = 32; blue, lateral nucleus, n = 27). Total n = 75 neurons.
Fig. 4.
Fig. 4.
Sensitivity of stimulus response to background reward in two amygdala neurons. A: variations in background reward probability. Left: response to rewarded stimulus (PS = 0.9). The response occurred when background reward probability was low (PB = 0.0, top), decreased when background reward probability increased to PB = 0.9 (middle) and reappeared when background reward dropped again to PB = 0.0 (bottom). Note that visual stimulus and reward probability were identical during the stimulus at top, middle, and bottom (shaded). Right: absence of response in same neuron to unrewarded stimulus (PS = 0.0) irrespective of background reward probability (PB = 0.0 and PB = 0.9). B: variations in background reward magnitude. Left: typical loss of response to rewarded stimulus (PS = 0.9) when increasing background reward probability from PB = 0.0 (top) to PB = 0.9 (bottom), at constant reward magnitude of 0.4 ml during stimulus and background. Right: appearance of stimulus response in same neuron with lowered reward magnitude during background (0.2 ml) compared with stimulus (0.4 ml). Reward probability was identical during stimulus and background (PS = PB = 0.9). Bin width = 10 ms.
Fig. 5.
Fig. 5.
Sensitivity of population stimulus response to background reward probability. Left: response decrease to rewarded stimulus (PS = 0.9) on increase in background reward from PB = 0.0 to PB = 0.9 (top to middle), and recovery of stimulus response with background reward decrease to PB = 0.0 (bottom). Right: lack of background reward influence on response to the unrewarded stimulus (PS = 0.0). Responses were averaged from all 71 neurons activated by rewarded stimulus, separately for the 6 trial types. Bin width = 10 ms.
Fig. 6.
Fig. 6.
Population analysis of neuronal sensitivity to background reward probability. A: responses to identically rewarded stimulus (PS = 0.9) with background reward probability varying between PB = 0.0 and PB = 0.9. Dots show means of percent activity increases from 71 activated neurons ± SE. B: average stimulus responses with background reward magnitude changing from 0.4 and 0.2 ml. Stimulus reward was fixed in probability (PS = 0.9) and magnitude (0.4 ml). Boxes below graph indicate reward probabilities (PB) and magnitudes (ml) during backgrounds. n = 13 neurons with activating stimulus responses. C: statistical difference levels for background reward-sensitive stimulus responses in individual neurons. Specified P values resulted from 2-way ANOVA on neuronal responses to the rewarded vs. unrewarded stimuli (PS = 0.9 vs. PS = 0.0; factor 1) set against unrewarded vs. rewarded backgrounds (PB = 0.0 vs. PB = 0.9 vs. PB = 0.0; factor 2). n = 75 neurons. D: discrimination of neuronal activity with receiver operating characteristic (ROC) analysis (75 neurons, of which 4 showed depressant responses). Black and striped bars: responses to stimuli set against different background reward probabilities; mean area under the curve: P = 0.81 with ROC P < 0.5 in 4 neurons replaced by 1.0-P (black: statistical P < 0.01 in 66 of 75 neurons, permutation test with 1,000 repetitions; striped: 9 neurons with statistical P > = 0.01). Gray bars: activity during background varying mostly insignificantly between background reward probabilities (PB = 0.0 and PB = 0.9; mean ROC P = 0.55; statistical P < 0.01 in 6 of 75 neurons). ROC values farther away from P = 0.5 suggest better response discrimination.
Fig. 7.
Fig. 7.
Rapid change of response to rewarded stimulus (PS = 0.9) after change of background reward. A: reduction of average population responses after increase of background reward from PB = 0.0 (all trials: black line) to PB = 0.9 (circle, 1st, 2nd, 3rd, 4th and all trials after change: blue, purple, red, brown, black). B: median activity during 100- to 400-ms poststimulus interval plotted across consecutive trials following background reward increase, starting with 1st trial after increase. C: population response increase after decrease of background reward from PB = 0.9 to PB = 0.0 (circle). Analogous color code as in A. D: median activity following background reward decrease. Data in A–D are from the same 71 neurons activated by the rewarded stimulus. Bin width = 10 ms.
Fig. 8.
Fig. 8.
Lack of responses to pseudorandomly timed reward delivery in background reward-sensitive neurons. Population histogram shows averaged activity of 71 neurons the activating stimulus responses of which were sensitive to background reward probability. Recordings were obtained during stimulus and background periods (reward P = 0.9 in both periods). Bin width = 10 ms.
Fig. 9.
Fig. 9.
Insensitivity or irregular sensitivity to background reward in single amygdala neurons. A: response potentially reflecting stimulus-reward pairing or visual properties. Maintained response to rewarded stimulus (PS = 0.9, left) irrespective of unrewarded (PB = 0.0) or rewarded background (PB = 0.9). No response to unrewarded stimulus (PS = 0.9, right). B: potential attention response. Top left: significant response to rewarded stimulus (PS = 0.9) set against unrewarded background (PB = 0.0). Bottom right: significant response to unrewarded stimulus (PS = 0.0) set against rewarded background (PB = 0.9). The response occurred whenever reward probabilities differed between stimulus and background. The stimulus responses at bottom left and top right were insignificant. This neuron showed also a nondifferential response to the fixation spot. C: potential response to positive temporal reward-prediction error. Left: response to randomly timed reward during the main task. Right: lack of significant response following fully predicted reward in the control task with fixed 2.0-s stimulus-reward interval (reward probability P = 1.0; difference against left: P < 0.002; 2-tailed Mann-Whitney test). No background reward (PB = 0.0). Bin width = 10 ms in A–C.

Similar articles

Cited by

References

    1. Aggleton JP, Passingham RE. Stereotaxic surgery under X-ray guidance in the rhesus monkey, with special reference to the amygdala. Exp Brain Res 44: 271–276, 1981 - PubMed
    1. Baker AG. Conditioned inhibition arising from a between-sessions negative correlation. J Exp Psychol 3: 144–155, 1977
    1. Balsam PD, Fairhurst S, Gallistel CR. Pavlovian contingencies and temporal information. J Exp Psychol Anim Behav Proc 32: 284–294, 2006 - PubMed
    1. Balsam PD, Gallistel CR. Temporal maps and informativeness in associative learning. Trends Neurosci 32: 73–78, 2008 - PMC - PubMed
    1. Baxter MG, Parker A, Lindner CCC, Izquierdo AD, Murray EA. Control of response selection by reinforcer value requires interaction of amygdala and orbital prefrontal cortex. J Neurosci 20: 4311–4319, 2000 - PMC - PubMed

Publication types

LinkOut - more resources