. 2010 Feb;103(2):1093-103.
doi: 10.1152/jn.00792.2009. Epub 2009 Dec 23.

Rectification of the EMG signal impairs the identification of oscillatory input to the muscle

Affiliations

Rectification of the EMG signal impairs the identification of oscillatory input to the muscle

Osmar Pinto Neto et al. J Neurophysiol. 2010 Feb.

Abstract

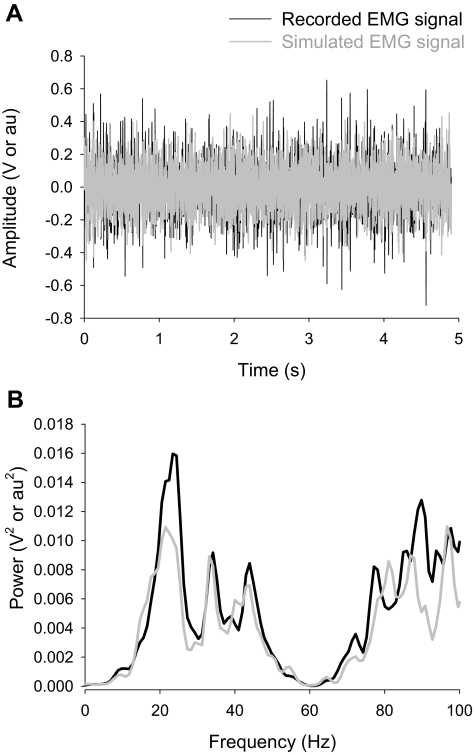
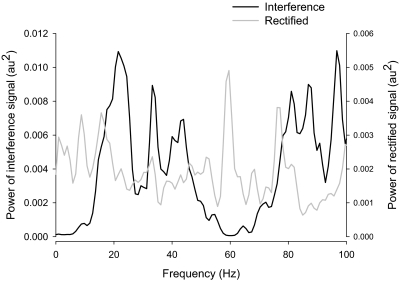
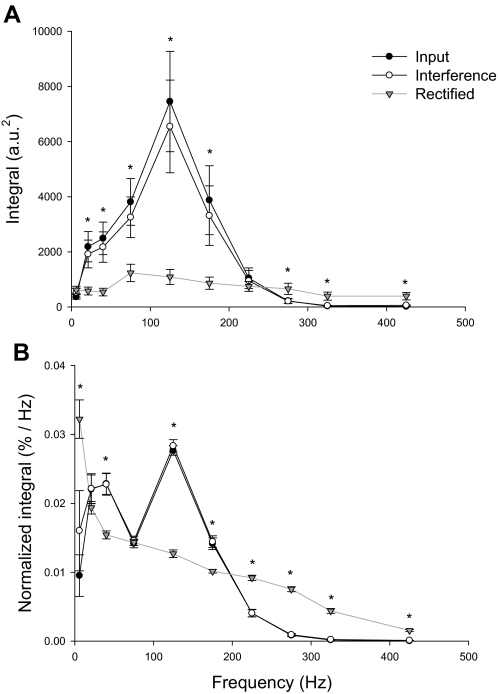
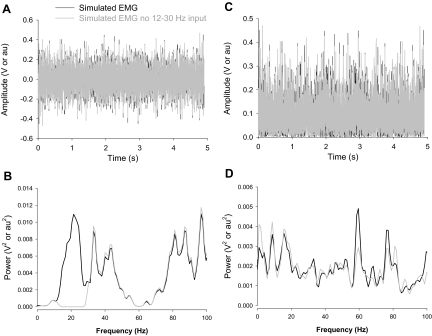
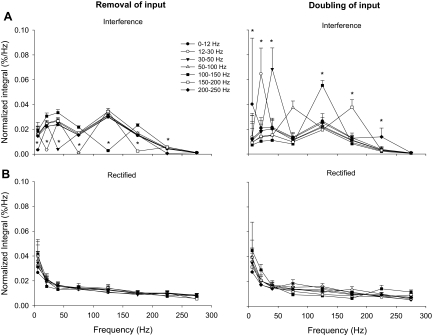
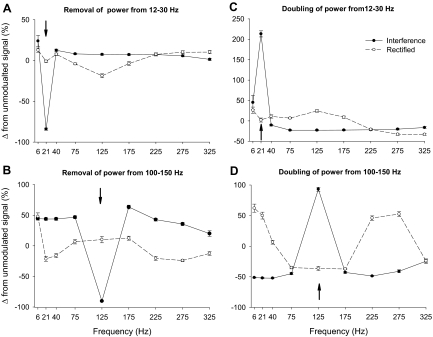
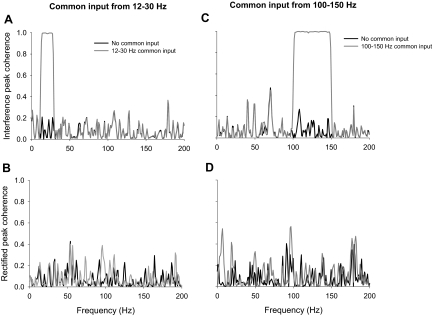
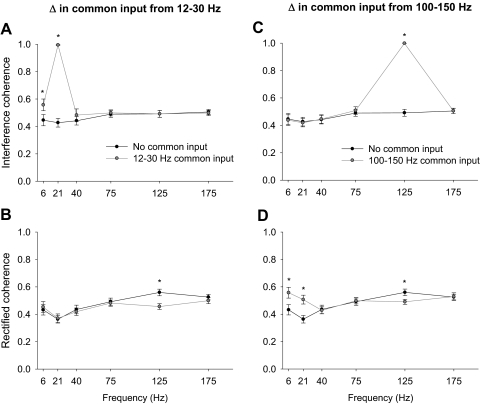
Rectification of EMG signals is a common processing step used when performing electroencephalographic-electromyographic (EEG-EMG) coherence and EMG-EMG coherence. It is well known, however, that EMG rectification alters the power spectrum of the recorded EMG signal (interference EMG). The purpose of this study was to determine whether rectification of the EMG signal influences the capability of capturing the oscillatory input to a single EMG signal and the common oscillations between two EMG signals. Several EMG signals were reconstructed from experimentally recorded EMG signals from the surface of the first dorsal interosseus muscle and were manipulated to have an oscillatory input or common input (for pairs of reconstructed EMG signals) at various frequency bands (in Hz: 0-12, 12-30, 30-50, 50-100, 100-150, 150-200, 200-250, 250-300, and 300-400), one at a time. The absolute integral and normalized integral of power, peak power, and peak coherence (for pairs of EMG signals) were quantified from each frequency band. The power spectrum of the interference EMG accurately detected the changes to the oscillatory input to the reconstructed EMG signal, whereas the power spectrum of the rectified EMG did not. Similarly, the EMG-EMG coherence between two interference EMG signals accurately detected the common input to the pairs of reconstructed EMG signals, whereas the EMG-EMG coherence between two rectified EMG signals did not. The frequency band from 12 to 30 Hz in the power spectrum of the rectified EMG and the EMG-EMG coherence between two rectified signals was influenced by the input from 100 to 150 Hz but not from the input from 12 to 30 Hz. The study concludes that the power spectrum of the EMG and EMG-EMG coherence should be performed on interference EMG signals and not on rectified EMG signals because rectification impairs the identification of the oscillatory input to a single EMG signal and the common oscillatory input between two EMG signals.


Figures

FIG. 1.
FIG. 1.
Representative example of a reconstructed (simulated) electromyographic (EMG) signal. An EMG signal was reconstructed based on a recorded EMG from the first dorsal interosseus (FDI) muscle when the subjects exerted a constant isometric force equal to 15% maximal voluntary contraction. The top panel (A) demonstrates the interference EMG signal recorded from the FDI muscle (black line) and the reconstructed interference EMG signal (gray line) from the same subject. The bottom panel (B) demonstrates the power spectrum for each signal. It is evident that the reconstructed signal contains peak frequencies and amplitudes similar to those of the recorded EMG signal and thus represents a signal that is as complex as an EMG signal. Note that power at 60 Hz (noise) was very small in the recorded signal and was not due to a notch filter set at 60 Hz in the hardware or software.
FIG. 2.
FIG. 2.
Representative example of interference and rectified power spectra of a reconstructed EMG signal. This figure demonstrates the power spectra of the interference (black line) and rectified (gray line) EMGs from a reconstructed EMG signal. Although the power spectrum of the interference EMG and rectified EMG appear to have similar peaks (20, 35, and 80 Hz, all approximate values), it is clear that the power spectra of the 2 signals are different for the following reasons: 1) the rectified reconstructed EMG exhibits peaks at different frequencies (e.g., 5, 10, and 60 Hz) and 2) the interference reconstructed EMG has distinct peaks at 40, 85, and 95 Hz, which were part of the reconstructed EMG signal but are not evident in the power spectrum of the rectified reconstructed EMG signal.
FIG. 3.
FIG. 3.
Comparison of input, interference, and rectified power spectra of reconstructed EMG signals. This figure demonstrates the integral (A) and normalized integral (B) of predetermined frequency bands within the input signal (black line, black circles), the power spectra of interference reconstructed EMG signal (black line, white circles), and the power spectra of the rectified reconstructed EMG signal (gray line, gray triangles). The integrals (A) and normalized integrals (B) of the reconstructed interference EMG signals were not significantly different (P > 0.2) from those obtained from the input. In contrast, the integrals (A) and normalized integrals (B) of the reconstructed rectified EMG signal were significantly different from the input and interference EMG signals at all frequency bands (P < 0.001), except from 0 to 12 and 200 to 250 Hz (P > 0.2). The asterisk (*) indicates significant differences between the rectified EMG signal and the input and interference EMG.
FIG. 4.
FIG. 4.
Representative example of reconstructed EMG signals with and without input from 12 to 30 Hz. The column on the left (A and B) demonstrates the interference (A) and associated power spectra (B) of the reconstructed EMG signals. The column on the right (C and D) demonstrates the rectified (C) and associated power spectra (D) of the same reconstructed EMG signals. It is evident from the comparison of B and D that the power spectrum of only the interference EMG captures the lack of power from 12 to 30 Hz (gray line).
FIG. 5.
FIG. 5.
Manipulation of power to the reconstructed EMG signals. This figure demonstrates the change in power spectra for the interference reconstructed EMG signal (top row; A) and rectified reconstructed EMG signal (bottom row; B) when the input was removed (left column) or doubled (right column) at various frequency bands (0–12, 12–30, 30–50, 50–100, 100–150, 150–200, 200–250 Hz). Removal or doubling of input was accurately captured in the power spectrum of the interference reconstructed EMG signal (A), whereas the power spectrum of the rectified reconstructed EMG signal did not change significantly with any manipulation (B). The unmodulated signal is reflected in the average of all the lines, excluding the points of manipulation (see also Fig. 3B). The asterisk (*) indicates significant differences (P < 0.001) between the modulated and unmodulated frequency band.
FIG. 6.
FIG. 6.
Relative change in power with manipulation from 12 to 30 and 100 to 150 Hz of the reconstructed EMG signal. The column on the left (A and B) demonstrates the change in power spectra relative to the not manipulated signal when power was absent from 12 to 30 (A) and 100 to 150 Hz (B) in the input signal, whereas the column on the right (C and D) demonstrates the change in power spectra when power was doubled from 12 to 30 (C) and 100 to 150 Hz (D) of the input signal. This figure demonstrates the following: 1) The relative change in power spectra for the interference reconstructed EMG signal (black solid line) accurately captured the removal and doubling of the manipulated frequency bands, whereas the change in power spectra of the rectified reconstructed EMG signal (dashed line) did not. 2) For the rectified reconstructed EMG signal when the input was manipulated from 12- to 30-Hz and 100- to 150-Hz power significantly changed in other frequencies (primarily from 100 to 150 Hz for the 12- to 30-Hz manipulation and 0–50 and 200–300 Hz for the 100- to 150-Hz manipulation). The arrows indicate the manipulated frequency band in each panel.
FIG. 7.
FIG. 7.
Representative example of EMG–EMG coherence with and without common input at 12–30 and 100–150 Hz. This figure demonstrates the change in EMG–EMG coherence for the interference (A, C) and rectified (B, D) approach when a pair of independent reconstructed EMG signals was manipulated to contain a common input at 12–30 (A, B) and 100–150 Hz (C, D). A common input from 12 to 30 (A) and 100 to 150 Hz (B) was accurately captured in the change of the EMG–EMG coherence when interference EMG signals were used, whereas the EMG–EMG coherence when rectified EMG signals were used did not change from 12 to 30 (A) or from 100 to 150 Hz (D).
FIG. 8.
FIG. 8.
EMG–EMG coherence with and without common input at 12–30 and 100–150 Hz. This figure demonstrates the change in EMG–EMG coherence for the interference (A, C) and rectified (B, D) approach when 19 pairs of independent reconstructed EMG signals were manipulated to contain a common input at 12–30 (A, B) and 100–150 Hz (C, D). A common input from 12 to 30 Hz was accurately captured in the change of the EMG–EMG coherence when interference EMG signals were used (A), whereas the EMG–EMG coherence when rectified EMG signals were used did not change from 12 to 30 Hz but decreased from 100 to 150 Hz (B). A common input from 100 to 150 Hz was accurately captured in the change of the EMG–EMG coherence when interference EMG signals were used (C), whereas the EMG–EMG coherence when rectified EMG signals were used significantly decreased from 100 to 150 Hz and increased from 0 to 30 Hz (D). The asterisk (*) indicates significant differences (P < 0.001) between the modulated and unmodulated signal.

Comment in

  • On the need for rectification of surface EMG.
    Halliday DM, Farmer SF. Halliday DM, et al. J Neurophysiol. 2010 Jun;103(6):3547; author reply 3548-9. doi: 10.1152/jn.00222.2010. J Neurophysiol. 2010. PMID: 20530508 No abstract available.
  • The nature of periodic input to the muscles.
    Boonstra TW. Boonstra TW. J Neurophysiol. 2010 Jul;104(1):576; author reply 577. doi: 10.1152/jn.00258.2010. J Neurophysiol. 2010. PMID: 20610794 Free PMC article. No abstract available.

References

    1. Amjad AM, Breeze P, Conway BA, Halliday DM, Rosenberg JR. A framework for the analysis of neuronal networks. Prog Brain Res 80: 239–255, 1989 - PubMed
    1. Baweja HS, Patel BK, Martinkewiz JD, Vu J, Christou EA. Removal of visual feedback alters muscle activity and reduces force variability during constant isometric contractions. Exp Brain Res 197: 35–47, 2009 - PMC - PubMed
    1. Boonstra TW, Roerdink M, Daffertshofer A, van Vugt B, van Werven G, Beek PJ. Low-alcohol doses reduce common 10- to 15-Hz input to bilateral leg muscles during quiet standing. J Neurophysiol 100: 2158–2164, 2008 - PubMed
    1. Brown P. Cortical drives to human muscle: the Piper and related rhythms. Prog Neurobiol 60: 97–108, 2000 - PubMed
    1. Chao EYS, An K-N, Cooney WP, 3rd, Linscheid RL. Biomechanics of the Hand: A Basic Research Study Teaneck, NJ: World Scientific Publishing, 1989

Publication types

LinkOut - more resources