. 2010 Mar;103(3):1179-94.
doi: 10.1152/jn.00364.2009. Epub 2009 Dec 23.

The functional anatomy of a perceptual decision in the human brain

Affiliations

The functional anatomy of a perceptual decision in the human brain

Andrew S Kayser et al. J Neurophysiol. 2010 Mar.

Abstract

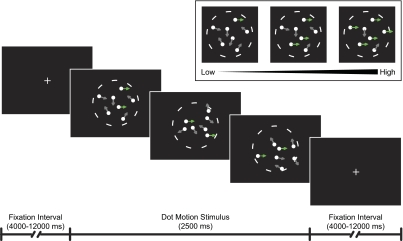
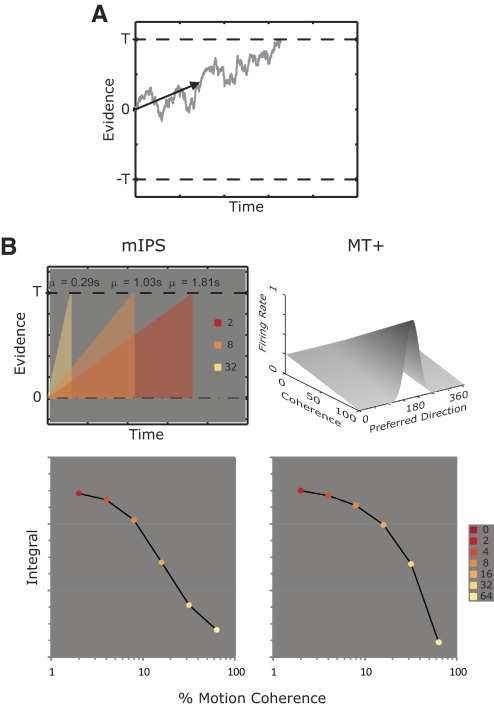
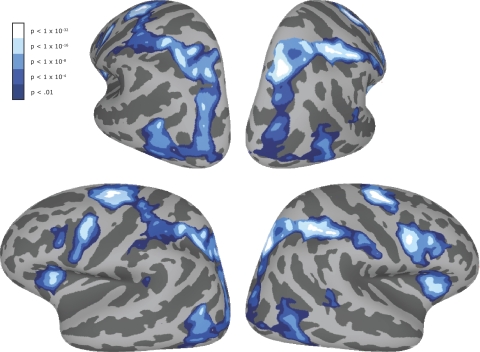
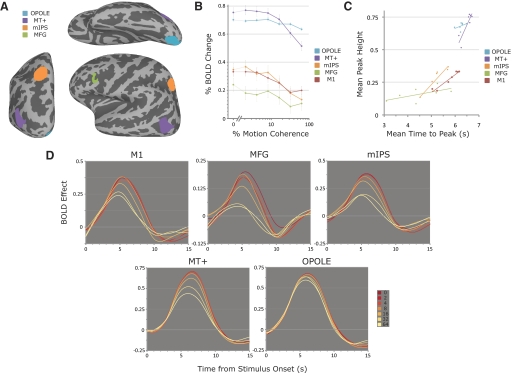
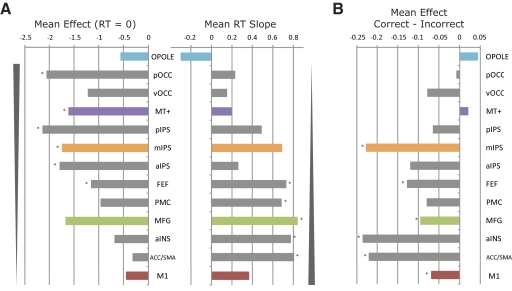
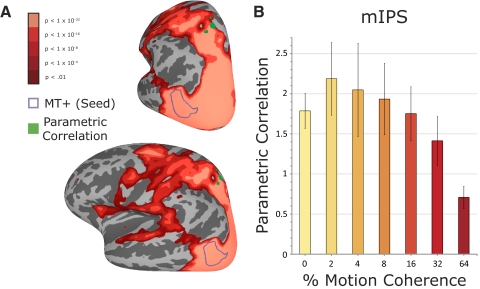
Our ability to make rapid decisions based on sensory information belies the complexity of the underlying computations. Recently, "accumulator" models of decision making have been shown to explain the activity of parietal neurons as macaques make judgments concerning visual motion. Unraveling the operation of a decision-making circuit, however, involves understanding both the responses of individual components in the neural circuitry and the relationships between them. In this functional magnetic resonance imaging study of the decision process in humans, we demonstrate that an accumulator model predicts responses to visual motion in the intraparietal sulcus (IPS). Significantly, the metrics used to define responses within the IPS also reveal distinct but interacting nodes in a circuit, including early sensory detectors in visual cortex, the visuomotor integration system of the IPS, and centers of cognitive control in the prefrontal cortex, all of which collectively define a perceptual decision-making network.


Figures

Fig. 1.
Fig. 1.
Bidirectional dot-motion discrimination task. Following a variable (4–12 s) interstimulus interval in which they fixated the center of the screen, subjects were cued to the upcoming stimulus by a decrease in the contrast of the fixation cross. A motion stimulus subsequently appeared for 2,500 ms within a circular aperture subtending 7.5° of visual angle (dashed circle). For each trial, this stimulus consisted of a set of white dots in which a constant proportion (but changing subset) of the dots moved coherently (green arrows) on a random-motion background (gray arrows). The percentage of coherently moving dots varied across trials from low to high (inset): in this experiment, these values ranged from 0% (i.e., no motion coherence) to 64% in discrete steps. Subjects viewed the stimulus without blinking or moving their gaze from the central fixation cross. Once they identified the direction of motion, they were instructed to make a button-press response both as accurately and as quickly as possible, but with an emphasis on accuracy.
Fig. 2.
Fig. 2.
Behavioral data. Reaction time and accuracy ± SEs across coherence for all subjects. (Negative log likelihoods of the model fits for all subjects can be found in Table 2.) Note that no accuracy is shown for the 0% motion coherence point because it is 0.50 by construction.
Fig. 3.
Fig. 3.
A: in the diffusion model, evidence accumulates over time through a process that is contaminated by noise (shown by the sample path in gray). Evidence builds until it reaches a threshold (denoted here by T and −T), when a decision corresponding to that threshold is made. In the model, the rate of accumulation can be parameterized by a mean vector (shown in black) whose value is proportional to the motion coherence of the stimulus. Additional parameters include the value of the threshold and a constant temporal offset that represents fixed factors such as initial lower-level visual processing and implementation of the motor response. B: both the diffusion model (left column) and previous knowledge of visual areas such as MT+ (middle temporal, right column) generated predictions for functional magnetic resonance imaging (fMRI). Based on primate data, we anticipated progressively decreasing responses in intraparietal sulcus (IPS) and MT+ with increasing motion coherence. Top left: as illustrated for 3 of the 7 different motion coherences (see legend for color scheme), evidence accumulates at different average rates. Because the blood oxygenation level–dependent (BOLD) signal is thought to represent a convolution of neuronal activity with the hemodynamic response, we hypothesized that the measured fMRI response should be proportional to the integral of the evidence, as represented by the triangular areas beneath each line. Bottom left: the integral under the curve for the mean response rates, in arbitrary units, is plotted against the coherence. Under the above-described hypothesis, the measured BOLD signal declines sigmoidally with increasing coherence (note that 0% coherence is not shown on the log scale). Top right: to generate predictions for the responses of MT+, we relied on findings from macaque neurophysiology. Graphed at top are the normalized firing rate responses of neurons selective to different directions of motion across motion coherences from 0 to 100%, based on the work of Britten and colleagues (Britten et al. 1993; Niwa and Ditterich 2008; Rees et al. 2000). As motion coherence increases, the low but diffuse firing rates related to the random-motion component of the stimulus decline, whereas the large but focal firing rates for those neurons sensitive to the direction of motion increase substantially. Bottom right: we assume that the BOLD response captured within a single voxel represents the pooled activity of neurons of many preferred directions. Under this assumption and using parameters taken from Rees and colleagues (2000) (see methods), the measured BOLD signal declines progressively across motion coherences from 0 through 64%.
Fig. 4.
Fig. 4.
Brain surface representing the fixed-effects group response as a parametric function of stimulus coherence, thresholded as described in the legend. Those areas that demonstrated a negative dependence on motion coherence are shown in cool/blue colors. The top row shows a posterior view of the left and right hemispheres of the Montreal Neurological Institute (MNI) template brain, respectively, whereas the bottom row shows the lateral views.
Fig. 5.
Fig. 5.
A: the 5 regions of interest (ROIs: occipital pole, MT+, medial IPS, middle frontal gyrus [MFG], and motion cortex [M1]) evaluated in the subsequent panels. Clockwise from top: the positions of the ROIs in ventral, lateral, and posterior views of the left hemisphere of the MNI template brain. B: the percentage BOLD signal change for each of these 5 ROIs is plotted against motion coherence for the purpose of showing the shape and timing of the BOLD effect as a function of motion coherence. C: the latency to the peak, and the amplitude of the peak, are plotted against each other for each of the 5 above-described regions. Each point represents a different coherence, color-coded by ROI. More posterior areas show relatively greater variation in amplitude, whereas more anterior areas show greater variation in latency. D: time course of activity for each of the 5 ROIs across the 7 motion-coherence values.
Fig. 6.
Fig. 6.
A, leftmost panel: the weighted contrast of the reaction time (RT)–independent effects of motion coherence (see methods) is shown for each of 13 ROIs, with those of Fig. 5 highlighted. In the middle panel, the correlation of the beta values from each region, averaged across motion coherence, is shown. Asterisks indicate values that are significantly different from zero (P < 0.05). B: consistent with the correlation values, the difference in beta values between error and correct trials (averaged across 2, 4, and 8% motion coherence, for which enough error trials were available) becomes progressively larger as one proceeds from posterior to anterior cortex.
Fig. 7.
Fig. 7.
A: all areas whose activity is correlated with MT+ across all motion coherences are shown, thresholded at P < 0.001 (uncorrected). In green is outlined an area including the border of the anterior and medial IPS: activity in this area not only correlates with, but also varies parametrically with, activity in MT+. B: the z-scored correlation between MT+ and this IPS region, averaged across subjects, for each motion coherence.

Similar articles

Cited by

References

    1. Anderson JR. How Can the Human Mind Occur in the Physical Universe? New York: Oxford Univ. Press, 2007
    1. Arthurs OJ, Boniface S. How well do we understand the neural origins of the fMRI BOLD signal? Trends Neurosci 25: 27–31, 2002 - PubMed
    1. Astafiev SV, Shulman GL, Stanley CM, Snyder AZ, Van Essen DC, Corbetta M. Functional organization of human intraparietal and frontal cortex for attending, looking, and pointing. J Neurosci 23: 4689–4699, 2003 - PMC - PubMed
    1. Beck DM, Kastner S. Top-down and bottom-up mechanisms in biasing competition in the human brain. Vision Res 49: 1154–1165, 2009 - PMC - PubMed
    1. Beck JM, Ma WJ, Kiani R, Hanks T, Churchland AK, Roitman J, Shadlen MN, Latham PE, Pouget A. Probabilistic population codes for Bayesian decision making. Neuron 60: 1142–1152, 2008 - PMC - PubMed

Publication types

MeSH terms

LinkOut - more resources