. 2010 Feb 15;21(4):584-96.
doi: 10.1091/mbc.e09-07-0580. Epub 2009 Dec 23.

Vascular endothelial-cadherin stabilizes at cell-cell junctions by anchoring to circumferential actin bundles through alpha- and beta-catenins in cyclic AMP-Epac-Rap1 signal-activated endothelial cells

Affiliations

Vascular endothelial-cadherin stabilizes at cell-cell junctions by anchoring to circumferential actin bundles through alpha- and beta-catenins in cyclic AMP-Epac-Rap1 signal-activated endothelial cells

Kazuomi Noda et al. Mol Biol Cell. .

Abstract

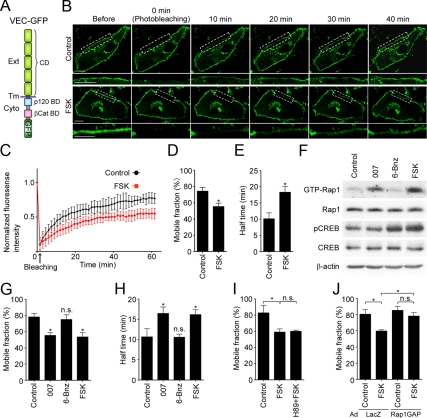
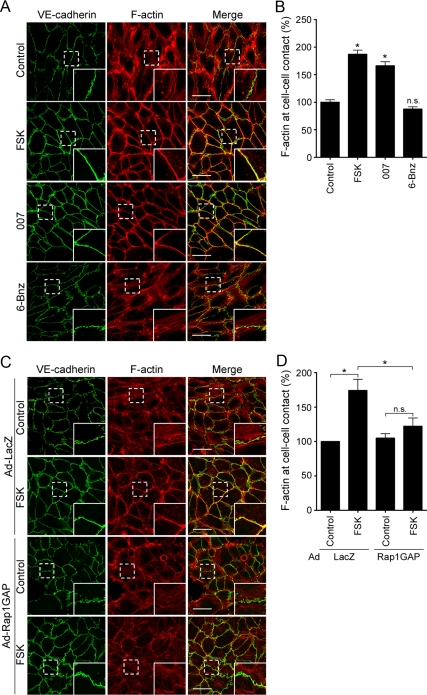
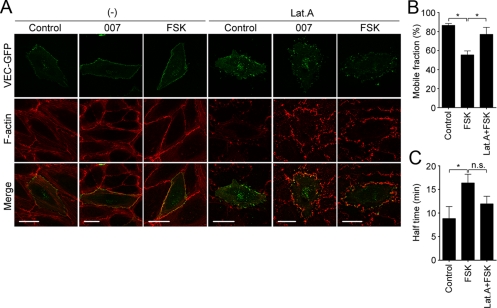
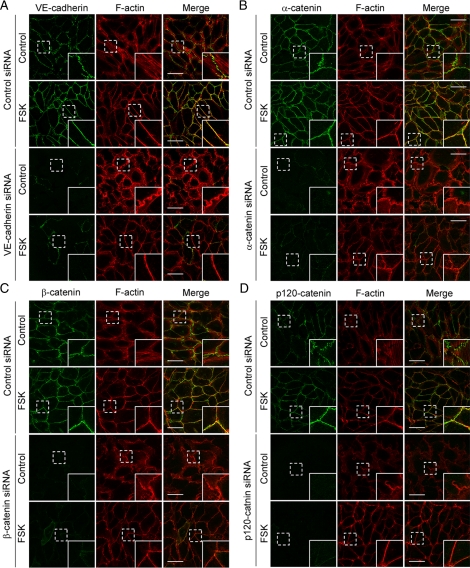
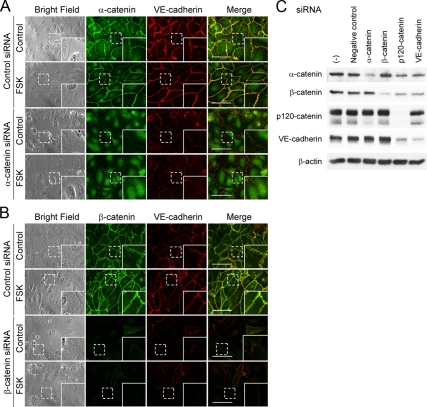
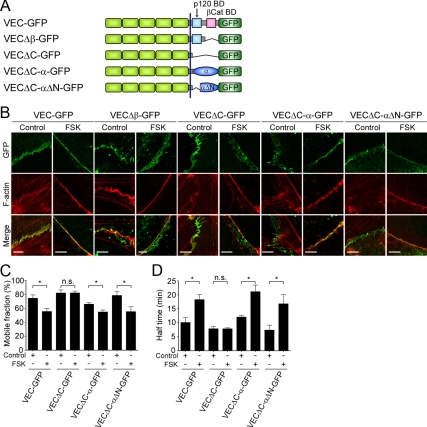
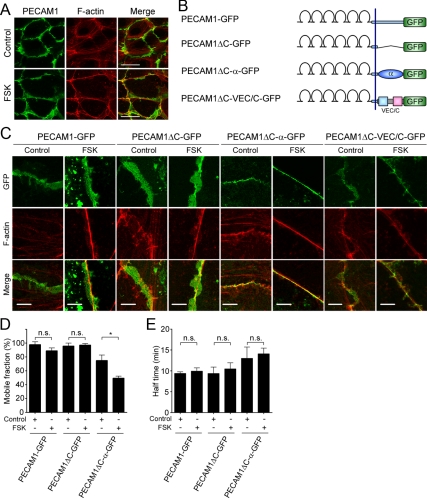
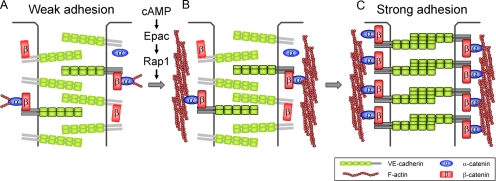
Vascular endothelial (VE)-cadherin is a cell-cell adhesion molecule involved in endothelial barrier functions. Previously, we reported that cAMP-Epac-Rap1 signal enhances VE-cadherin-dependent cell adhesion. Here, we further scrutinized how cAMP-Epac-Rap1 pathway promotes stabilization of VE-cadherin at the cell-cell contacts. Forskolin induced circumferential actin bundling and accumulation of VE-cadherin fused with green fluorescence protein (VEC-GFP) on the bundled actin filaments. Fluorescence recovery after photobleaching (FRAP) analyses using VEC-GFP revealed that forskolin stabilizes VE-cadherin at cell-cell contacts. These effects of forskolin were mimicked by an activator for Epac but not by that for protein kinase A. Forskolin-induced both accumulation and stabilization of junctional VEC-GFP was impeded by latrunculin A. VE-cadherin, alpha-catenin, and beta-catenin were dispensable for forskolin-induced circumferential actin bundling, indicating that homophilic VE-cadherin association is not the trigger of actin bundling. Requirement of alpha- and beta-catenins for forskolin-induced stabilization of VE-cadherin on the actin bundles was confirmed by FRAP analyses using VEC-GFP mutants, supporting the classical model that alpha-catenin could potentially link the bundled actin to cadherin. Collectively, circumferential actin bundle formation and subsequent linkage between actin bundles and VE-cadherin through alpha- and beta-catenins are important for the stabilization of VE-cadherin at the cell-cell contacts in cAMP-Epac-Rap1 signal-activated cells.


Figures

Figure 1.
Figure 1.
cAMP stabilizes VE-cadherin at cell–cell contacts through Epac, but not PKA. (A) Schematic illustration of VEC-GFP in which a GFP tag is fused to the carboxy terminus of full-length VE-cadherin. VE-cadherin consists of an extracellular region (Ext) consisting of five cadherin domains (CD), a transmembrane region (Tm), and a conserved cytoplasmic region (Cyto) containing p120–catenin-binding domain (p120 BD) and β-catenin-binding domain (βCat BD). (B) Confluent HUVECs plated on a collagen-coated glass-base dish were transfected with the plasmid encoding VEC-GFP. After 24 h, the cells were starved in medium 199 containing 1% BSA for 3 h and stimulated with vehicle (top, control) or 10 μM FSK (bottom) for 30 min. To measure the mobility of VEC-GFP at cell–cell junctions, GFP-positive cells surrounded by GFP-negative cells were selected and immediately subjected to FRAP analysis as described in Materials and Methods. Representative GFP images before and at the indicated time points after photobleaching are shown. Photobleached areas are marked by dotted rectangles and enlarged at the bottom of each image. Bar, 20 μm. (C) Quantitative analysis of FRAP experiments in B. Plot of normalized fluorescence intensity of VEC-GFP expressed in the cells stimulated with vehicle (control, black circles) or FSK (red squares) versus time (minutes) after photobleaching. Data are expressed as mean ± SD of five independent experiments. (D and E) The mobile fraction (D) and the recovery half-time (E) of VEC-GFP expressed in the cells stimulated with vehicle (control) or FSK were calculated from the fluorescence recovery curves shown in C. Data are expressed as mean ± SE of five independent experiments. (F) HUVECs starved in 0.5% BSA-containing medium 199 for 6 h were stimulated with either vehicle (control), 0.2 mM 007, 0.2 mM 6-Bnz, or 10 μM FSK for 15 min as indicated at the top. GTP-bound Rap1 was collected as described in Materials and Methods and subjected to Western blot analysis with anti-Rap1 antibody (GTP-Rap1). Aliquots of cell lysates were also subjected to Western blot analysis with anti-Rap1 (Rap1), anti-phospho-CREB (pCREB), anti-CREB (CREB), and anti-β-actin (β-actin) antibodies. (G and H) Confluent HUVECs expressing VEC-GFP were stimulated with vehicle (control), 0.2 mM 007, 0.2 mM 6-Bnz, or 10 μM FSK for 30 min and subjected to FRAP analysis as described in B. The mobile fraction of VEC-GFP (G) and its recovery half-time (H) were calculated similarly to D and E. Data are expressed as mean ± SE of six independent experiments. (I) Confluent HUVECs expressing VEC-GFP were starved in medium 199 containing 0.1% BSA for 3 h, treated with or without 10 μM H89 for 30 min, and subsequently stimulated with vehicle (control) or 10 μM FSK for 30 min as indicated at the bottom of each graph. The cells were then subjected to FRAP analysis as described in B. The mobile fraction of VEC-GFP was calculated similarly to D. (J) Confluent HUVECs plated on collagen-coated glass-base dish were transfected with the plasmid encoding VEC-GFP and infected with adenoviruses encoding either LacZ or Rap1GAP. After 24 h, the cells were starved, stimulated with FSK, and subsequently subjected to FRAP analysis as described in B. The mobile fraction of VEC-GFP was calculated similarly to D. Data are expressed as mean ± SE of four to five independent experiments. Significant differences from the control (D, E, G, and H) or between two groups (I and J) are indicated as *p < 0.05. n.s. indicates no significance between two groups.
Figure 2.
Figure 2.
cAMP induces circumferential actin bundle formation and accumulation of VE-cadherin on the bundled actin filaments through an Epac-Rap1 pathway. (A) Monolayer-cultured HUVECs starved in 0.5% BSA-containing medium 199 for 3 h were stimulated with vehicle (top, control), 10 μM FSK (second panel), 0.2 mM 007 (third panel), and 0.2 mM 6-Bnz (bottom) for 30 min. After stimulation, the cells were fixed, immunostained with anti-VE-cadherin antibody and visualized with Alexa 488-conjugated secondary antibody. The cells were also stained with rhodamine-phalloidin to visualize F-actin. Alexa 488 and rhodamine images were obtained through a confocal microscope. Alexa 488 (VE-cadherin, green), rhodamine (F-actin, red) and the merged (merge) images are shown as indicated at the top of each column. The boxed areas marked by dotted line in the images are enlarged in the bottom right corner of each image. (B) Levels of F-actin at cell–cell contacts observed in A were quantified as described in Materials and Methods. Values are expressed as a percentage relative to that in the control cells and shown as mean ± SE of >80 contacts. Similar results were obtained in three independent experiments. (C) Confluent HUVECs were infected with adenoviruses encoding either LacZ (Ad-LacZ) or Rap1GAP (Ad-Rap1GAP) as indicated at the left. After 24 h, the cells were starved in 0.5% BSA-containing medium 199 for 3 h and stimulated with vehicle (control) or 10 μM FSK for 30 min. The cells were then stained with anti-VE-cadherin antibody and visualized with Alexa 488-conjugated secondary antibody as described in A. The cells were also stained with rhodamine-phalloidin to visualize F-actin. Alexa 488 (VE-cadherin, green), rhodamine (F-actin, red) and the merged (merge) images are shown as indicated at the top of each column. The boxed areas marked by dotted line in the images are enlarged in the bottom right corner of each image. (D) Levels of F-actin at cell–cell contacts observed in C were quantified similarly to B. Values are expressed as a percentage relative to that in the control cells infected with adenoviruses encoding LacZ and are shown as mean ± SE of >100 contacts. Similar results were obtained in three independent experiments. Bars, 50 μm (A and C). Significant differences from the control (B) or between two groups (D) are indicated as *p < 0.05. n.s. indicates no significance between two groups.
Figure 3.
Figure 3.
Circumferential actin bundle formation is responsible for cAMP-induced stabilization of junctional VE-cadherin. (A) Confluent HUVECs transfected with the plasmid encoding VEC-GFP were starved in 0.5% BSA-containing medium 199 for 3 h and incubated with vehicle [left, (−)] or 200 nM Lat.A (right, Lat.A) for 30 min. The cells were then stimulated with vehicle (control), 0.2 mM 007 (007), and 10 μM FSK (FSK) for 30 min as indicated at the top and stained with rhodamine-phalloidin as described in legend of Figure 2A. GFP and rhodamine images were obtained through a confocal microscope. GFP (VEC-GFP), rhodamine (F-actin), and the merged (merge) images are shown as indicated at the left. Bars, 30 μm. (B and C) Confluent HUVECs expressing VEC-GFP were starved in medium 199 containing 1% BSA for 3 h, treated with or without 100 nM Lat.A for 30 min, and stimulated with vehicle (control) or 10 μM FSK for 30 min as indicated at the bottom of each graph. The cells were then subjected to FRAP analysis as described in the legend of Figure 1B. The mobile fraction of VEC-GFP (B) and its recovery half-time (C) were calculated as described in the legend of Figure 1, D and E. Data are expressed as mean ± SE of five to seven independent experiments. Significant differences between two groups are indicated as *p < 0.05. n.s. indicates no significance between two groups.
Figure 4.
Figure 4.
cAMP-induced circumferential actin bundling does not depend upon VE-cadherin–based cell–cell adhesions. (A–D) HUVECs were transfected with control siRNA (top panels of each figure) or with siRNAs targeting against VE-cadherin (A), α-catenin (B), β-catenin (C), and p120-catenin (D) (bottom panels of each figure), cultured for 48 h, and replated onto the collagen-coated glass-base dish. After 24 h, the cells were starved in medium 199 containing 0.5% BSA for 3 h and stimulated with vehicle (control) or 10 μM FSK for 30 min as indicated at the left of each figure. The cells were stained with anti-VE-cadherin (A), anti-α-catenin (B), anti-β-catenin (C), and anti-p120-catenin (D) antibodies and visualized with Alexa 488-conjugated secondary antibody as described in Figure 2A. The cells were also stained with rhodamine-phalloidin to visualize F-actin. Alexa 488 and rhodamine images were obtained through a confocal microscope. Alexa 488 images for VE-cadherin (A), α-catenin (B), β-catenin (C), and p120-catenin (D) are shown at the left column. Rhodamine (F-actin) and the merged (merge) images are shown at the middle and right columns, respectively. The boxed areas marked by dotted line in the images are enlarged in the bottom right corner of each image. Bars, 50 μm.
Figure 5.
Figure 5.
α- and β-Catenins are essential for cAMP-induced accumulation of VE-cadherin at cell–cell contacts. (A and B) HUVECs were transfected with control siRNA (top panels of each figure) or with siRNAs targeting against α-catenin (A) and β-catenin (B) (bottom panels of each figure) and stimulated with vehicle (control) or FSK as described in the legend of Figure 4. The cells were immunostained with either anti-α-catenin (A) or anti-β-catenin (B) antibody and with anti-VE-cadherin antibody and then visualized with Alexa 488- and Alexa 546-conjugated secondary antibodies, respectively. Phase contrast, Alexa 488 and Alexa 546 images were obtained using an IX81 inverted microscope (Olympus). Phase contrast (bright field), Alexa 488 (α-catenin in A and β-catenin in B), Alexa 546 (VE-cadherin), and the merged (merge) images are shown as indicated at the top of each column. The boxed areas marked by dotted line in the images are enlarged in the lower right corner of each image. Bars, 30 μm. (C) HUVECs were transfected without [(−)] or with control siRNA (negative control) or siRNAs targeting α-catenin, β-catenin, p120-catenin, and VE-cadherin as indicated at the top and cultured for 72 h. Cell lysates were subjected to Western blot analysis with anti-α-catenin, anti-β-catenin, anti-p120-catenin, anti-VE-cadherin, and anti-β-actin antibodies as indicated at the left.
Figure 6.
Figure 6.
α- and β-Catenins locate and stabilize VE-cadherin at the circumferential actin bundles. (A) Schematic illustrations of VEC-GFP and its mutants. VEC-GFP, VE-cadherin carboxy-terminally tagged with GFP; VEC-GFPΔβ-GFP, a VEC-GFP mutant lacking the β-catenin binding domain of VE-cadherin; VEC-ΔC-GFP, a VEC-GFP mutant lacking the cytoplasmic region of VE-cadherin; VECΔC-α-GFP, a VEC-GFP mutant in which the cytoplasmic region of VE-cadherin is replaced with α-catenin; and VECΔC-αΔN-GFP, a VEC-GFP mutant in which the cytoplasmic region of VE-cadherin is replaced with α-catenin lacking N-terminal β-catenin binding domain. (B) HUVECs were transfected with the plasmid encoding either VEC-GFP or its mutant as indicated at the top. The cells were starved in medium 199 containing 0.5% BSA for 3 h and stimulated with vehicle (control) or 10 μM FSK (FSK) for 30 min. The cells were stained with rhodamine-phalloidin to visualize F-actin as described in the legend of Figure 2A. GFP and rhodamine images were obtained through a confocal microscope. GFP, rhodamine (F-actin), and the merged (merge) images are shown as indicated at the left. The border between the untransfected cell and the cell expressing GFP tagged-VE-cadhein is shown. Bars, 5 μm. (C and D) Confluent HUVECs plated on collagen-coated glass-base dish were transfected with the plasmid encoding VEC-GFP, VECΔC-GFP, VECΔC-α-GFP, or VECΔC-αΔN-GFP as indicated at the bottom of each figure. The cells were starved, stimulated with vehicle (control) or 10 μM FSK for 30 min, and subjected to FRAP analysis as described in the legend of Figure 1B. The mobile fraction of VEC-GFP and its mutants (C) and their recovery half-time (D) were calculated as described in the legend of Figure 1, D and E. Data are expressed as mean ± SE of six to eight independent experiments. Significant differences between two groups are indicated as *p < 0.05. n.s. indicates no significance between two groups.
Figure 7.
Figure 7.
PECAM1 that is incapable of associating with actin cytoskeleton is not stabilized on the circumferential actin bundles. (A) Monolayer-cultured HUVECs were stimulated with vehicle (top, control) or 10 μM FSK (bottom) for 30 min as described in the legend of Figure 2A. After stimulation, the cells were immunostained with anti-PECAM1 antibody and visualized with Alexa 488-conjugated secondary antibody. The cells were also stained with rhodamine-phalloidin to visualize F-actin. Alexa 488 and rhodamine images were obtained through a confocal microscope. Alexa 488 (PECAM1), rhodamine (F-actin), and the merged (merge) images are shown as indicated at the top of each column. (B) Schematic illustrations of PECAM1-GFP and its mutants. PECAM1-GFP, PECAM1 carboxy-terminally tagged with GFP; PECAM1ΔC-GFP, a PECAM1-GFP mutant lacking the cytoplasmic region of PECAM1; PECAM1ΔC-α-GFP, a PECAM1-GFP mutant in which the cytoplasmic region of PECAM1 is replaced with α-catenin; and PECAM1ΔC-VEC/C-GFP, a PECAM1-GFP mutant in which the cytoplasmic region of PECAM1 is replaced with that of VE-cadherin. (C) HUVECs were transfected with the plasmid encoding either PECAM1-GFP or its mutant as indicated at the top. The cells were stimulated with vehicle (control) or 10 μM FSK and stained with rhodamine-phalloidin similarly to the legend of Figure 6B. GFP and rhodamine images were obtained through a confocal microscope. GFP, rhodamine (F- actin), and the merged (merge) images are shown as indicated at the left. The border between the untransfected cell and the cell expressing GFP tagged-PECAM1 is shown. (D and E) Confluent HUVECs plated on a collagen-coated glass-base dish were transfected with the plasmid encoding PECAM1-GFP, PECAM1ΔC-GFP, or PECAM1ΔC-α-GFP as indicated at the bottom of each graph. The cells were starved, stimulated with vehicle (control) or 10 μM FSK for 30 min, and subjected to FRAP analysis as described in the legend of Figure 1B. The mobile fraction of PECAM1-GFP and its mutants (D) and their recovery half-time (E) were calculated as described in the legend of Figure 1, D and E. Data are expressed as mean ± SE of five to six independent experiments. Significant differences between two groups are indicated as *p < 0.05. n.s. indicates no significance between two groups. Bars, 30 μm (A) and 5 μm (C).
Figure 8.
Figure 8.
Schematic representation of our proposed model that accounts for how VE-cadherin is stabilized at the cell–cell contacts in cAMP–Epac–Rap1 signal-activated endothelial cells. (A) In unstimulated endothelial cells, the majority of VE-cadherin molecules (∼75%) is mobile at cell–cell junctions, possibly due to the lack of circumferential actin bundles. VE-cadherin that does not associate with actin cytoskeleton has weak cell–cell adhesion activity. (B) When cAMP-Epac-Rap1 signal is activated, circumferential actin bundling occurs independently of VE-cadherin-based cell–cell adhesions. (C) Subsequently, α- and β-catenins link VE-cadherin to the bundled actin filaments, thereby stabilizing VE-cadherin at cell–cell contacts. Stabilization of VE-cadherin on the bundled actin filaments results in strong cell–cell adhesions. VE-cadherin that associates with bundled actin filaments through α- and β-catenins is outlined. α- and β-Catenins which link VE-cadherin to the bundled actin filaments are also outlined.

Similar articles

Cited by

References

    1. Abe K., Takeichi M. EPLIN mediates linkage of the cadherin catenin complex to F-actin and stabilizes the circumferential actin belt. Proc. Natl. Acad. Sci. USA. 2007;105:13–19. - PMC - PubMed
    1. Adamson R. H., Ly J. C., Sarai R. K., Lenz J. F., Altangerel A., Drenckhahn D., Curry F. E. Epac/Rap1 pathway regulates microvascular hyperpermeability induced by PAF in rat mesentery. Am. J. Physiol. Heart Circ. Physiol. 2008;294:H1188–H1196. - PubMed
    1. Andriopoulou P., Navarro P., Zanetti A., Lampugnani M. G., Dejana E. Histamine induces tyrosine phosphorylation of endothelial cell-to-cell adherens junctions. Arterioscler. Thromb. Vasc. Biol. 1999;19:2286–2297. - PubMed
    1. Arthur W. T., Quilliam L. A., Cooper J. A. Rap1 promotes cell spreading by localizing Rac guanine nucleotide exchange factors. J. Cell Biol. 2004;167:111–122. - PMC - PubMed
    1. Augustin H. G., Young K. G., Thurston G., Alitalo K. Control of vascular morphogenesis and homeostasis through the angiopoietin-Tie system. Nat. Rev. Mol. Cell Biol. 2009;10:165–177. - PubMed

Publication types

MeSH terms