. 2010 Feb 15;21(4):597-609.
doi: 10.1091/mbc.e09-05-0427. Epub 2009 Dec 23.

Interplay between ER exit code and domain conformation in CFTR misprocessing and rescue

Affiliations

Interplay between ER exit code and domain conformation in CFTR misprocessing and rescue

Gargi Roy et al. Mol Biol Cell. .

Abstract

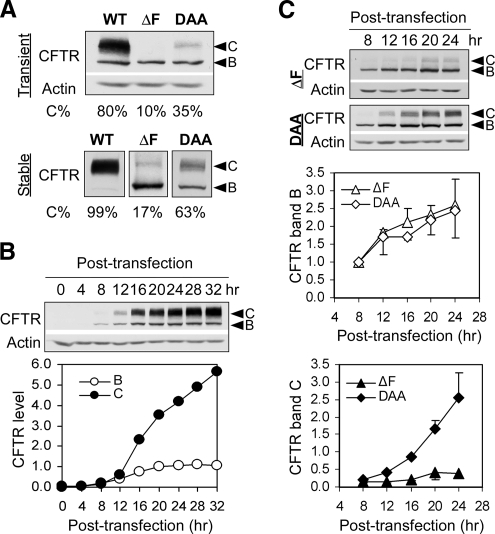
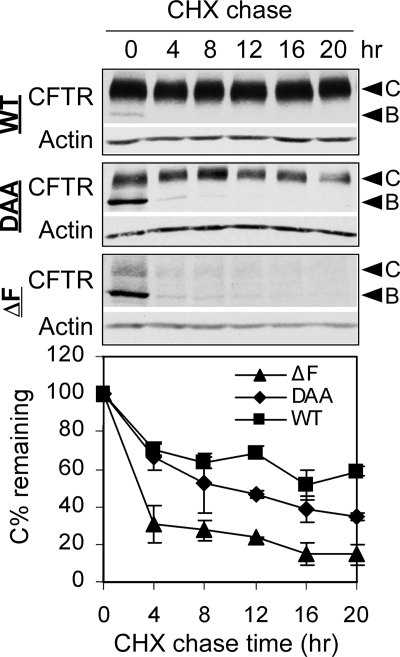
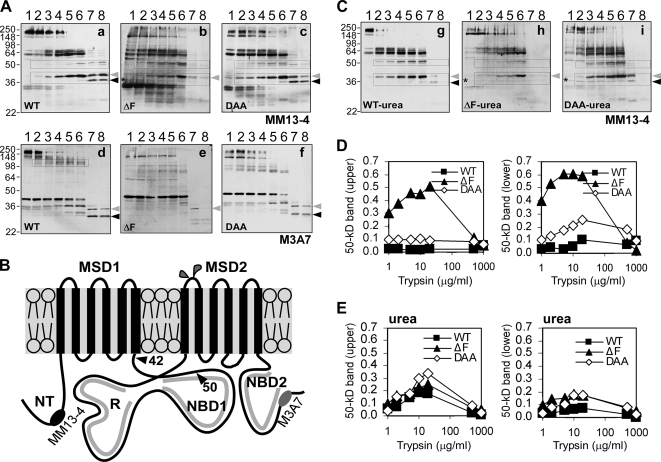
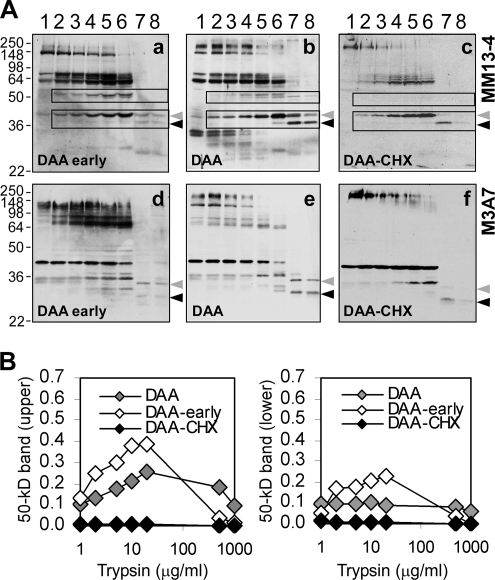
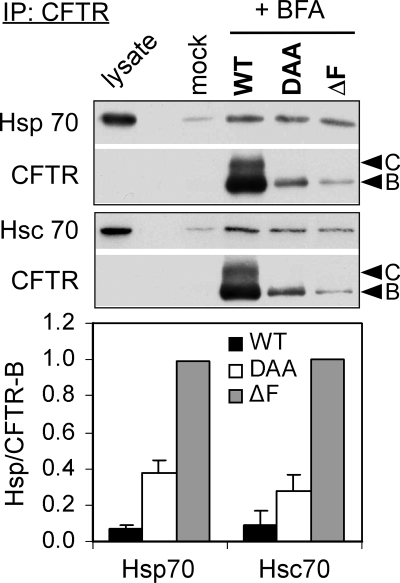
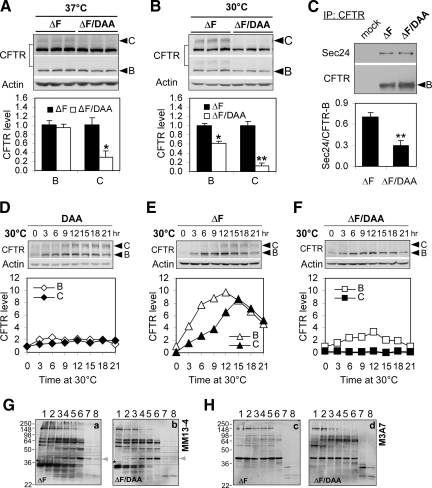
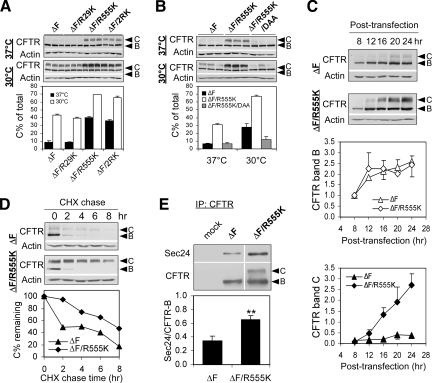
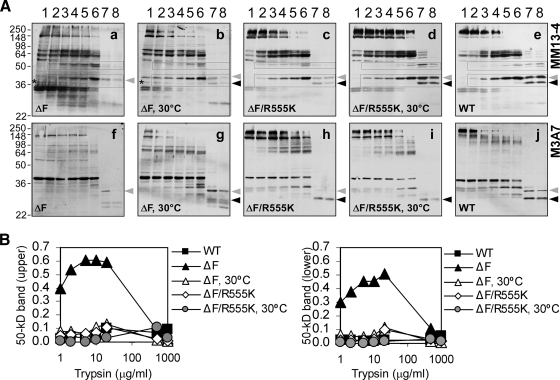
Multiple mutations in cystic fibrosis transmembrane conductance regulator (CFTR) impair its exit from the endoplasmic reticulum (ER). We compared two processing mutants: DeltaF508 and the ER exit code mutant DAA. Although both have severe kinetic processing defect, DAA but not DeltaF508 has substantial accumulation in its mature form, leading to higher level of processing at the steady state. DAA has much less profound conformational abnormalities. It has lower Hsp70 association and higher post-ER stability than DeltaF508. The ER exit code is necessary for DeltaF508 residual export and rescue. R555K, a mutation that rescues DeltaF508 misprocessing, improves Sec24 association and enhances its post-ER stability. Using in situ limited proteolysis, we demonstrated a clear change in trypsin sensitivity in DeltaF508 NBD1, which is reversed, together with that of other domains, by low temperature, R555K or both. We observed a conversion of the proteolytic pattern of DAA from the one resembling DeltaF508 to the one similar to wild-type CFTR during its maturation. Low temperature and R555K are additive in improving DeltaF508 conformational maturation and processing. Our data reveal a dual contribution of ER exit code and domain conformation to CFTR misprocessing and underscore the importance of conformational repair in effective rescue of DeltaF508.


Figures

Figure 1.
Figure 1.
DAA has greater post-ER accumulation than ΔF508. (A) Top, HEK293 cells were transiently transfected with wild-type (WT), ΔF508 (ΔF), and DAA CFTR. After 24 h at 37°C, cells were lysed and equal amounts of lysates were immunoblotted for CFTR. CFTR levels in core glycoform (band B) and complex glycoform (band C) were quantified by densitometry. Percentage of band C of the total was calculated for each CFTR construct. Bottom, HEK293 cells stably expressing the indicated forms of CFTR were lysed. The lysates were immunoblotted for CFTR, and the level of CFTR was quantified as above. (B) HEK293 cells were transiently transfected with WT CFTR. At the indicated time after transfection, cells were lysed, and the lysates were immunoblotted for CFTR. The level of CFTR in bands B and C was quantified by densitometry. (C) The synthesis and maturation of DAA and ΔF CFTR were followed in HEK293 cells between 8 and 24 h after transfection. CFTR levels in bands B and C were quantified by densitometry and normalized to the levels of actin. To facilitate comparison, all values of an individual CFTR construct were further normalized to the value of band B at the first time point. The time courses have been performed twice independently. Representative immunoblotting images are shown on the top, and the means and SEMs are plotted in the charts below.
Figure 2.
Figure 2.
DAA is much more stable than ΔF508 in post-ER compartments. HEK293 cells stably expressing WT, DAA, or ΔF were incubated with 100 μg/ml CHX for the indicated time periods. Cells were then lysed, and the lysates were immunoblotted for CFTR. CFTR levels in band C were quantified, normalized to actin, and expressed as the percentage of the value at the 0 time point. The experiments were conducted twice. Representative immunoblotting images are shown above, and the means and the SEMs are displayed below.
Figure 3.
Figure 3.
DAA has minimal conformational deviation from wild-type CFTR when compared with ΔF508. (A) Equal amounts of microsomes prepared from HEK293 cells stably expressing the indicated CFTR constructs were subjected to digestion at increasing trypsin concentration. The digestion mixtures were immunoblotted with CFTR mAb MM13-4 (a–c) or M3A7 (d–f). The trypsin concentrations are 0, 0.5, 1, 2.5, 5, 10, 250, and 500 μg/ml. The 42- and 37-kDa fragments in a–c were labeled with gray and black arrowheads, respectively, and the 34- and 30-kDa fragments in d–f were labeled with gray and black arrowheads, respectively. (B) Cartoon of CFTR showing domains, antibody epitopes, glycosylation sites, and the predicted trypsin cleavage sites that generate the 50- and 42-kDa fragments when probed by MM13-4. (C) Microsomes prepared from HEK293 cells stably expressing WT, ΔF, or DAA were subjected to urea wash followed by in situ limited proteolysis and then immunoblotting with MM13-4. (D) The ∼50-kDa bands in A, a–c, were quantified by densitometry and normalized to the total level of CFTR in the absence of trypsin (lane 1). (E) The ∼50-kDa bands in C were quantified in the same manner.
Figure 4.
Figure 4.
Global conformational changes accompany DAA maturation. (A) Microsomes derived from HEK293 cells harboring DAA CFTR at different stages of maturation were subjected to in situ limited proteolysis. To capture DAA at an earlier stage of maturation, HEK293 cells were transiently transfected with DAA CFTR, and microsomes were prepared 12 h after transfection (DAA early). To remove the immature form (band B) of DAA CFTR, HEK293 cells stably expressing DAA were treated with CHX for 12 h before microsome preparation (DAA-CHX). (B) The ∼50-kDa bands in A, a–c, were quantified as described above.
Figure 5.
Figure 5.
DAA has much lower association with Hsp70s than ΔF508. HEK293 cells were transiently transfected with WT, DAA, or ΔF CFTR. Sixteen hours after transfection, BFA was added at 10 μg/ml, and the cells were incubated at 37°C for an additional 24 h. Mock transfected HEK293 cells served as control (mock). The cells were lysed and coimmunoprecipitation was conducted using protein G beads coated with CFTR mAb 13-1 as described in Materials and Methods. A small fraction of mock cell lysate (lysate) and equal proportions of the immunoprecipitated proteins were separated by SDS-PAGE and immunoblotted for the Hsp70s and CFTR. The levels of Hsp70s were subtracted by those of the mock and then normalized to the level of CFTR in band B. Two independent experiments were performed. To facilitate data analysis, the levels of Hsp70-association for WT and DAA were normalized to that of ΔF in each individual experiment, and then the means and SEMs were calculated. Representative immunoblotting images are shown above, and the means and SEMs are plotted below.
Figure 6.
Figure 6.
ΔF508 CFTR utilizes the “DAD” motif as ER exit code. (A and B) HEK293 cells were transiently transfected with ΔF or ΔF/DAA CFTR and incubated at 37°C. Twenty-four hours after transfection, the cells were incubated at 37°C (A) or 30°C (B) for an additional 16 h before they were lysed. Cell lysates were immunoblotted for CFTR and actin. Multiple exposures were taken to ensure that the intensity of bands C and B lies within the quantifiable range. The properly exposed bands (labeled by arrowheads) were quantified by densitometry. CFTR levels in bands B and C were normalized to actin and then to the values of the ΔF. The means and the SEMs are plotted in the charts. The values for ΔF and ΔF/DAA were compared by two-tailed and unpaired t test. *p ≤ 0.05 and **p ≤ 0.01, n = 3. (C) HEK293 cells were transiently transfected with ΔF or ΔF/DAA CFTR, 20 h after transfection, cells were lysed, and quantitative coimmunoprecipitation was conducted using protein G beads coated with CFTR mAb M3A7. The immunoprecipitated proteins were separated by SDS-PAGE and immunoblotted for Sec24 and CFTR. Mock-transfected HEK293 cells (mock) served as the negative control. The level of the associated Sec24 was first subtracted by that of mock and then normalized to the level of CFTR in band B. Four independent experiments were conducted. To make the data comparable, the Sec24/CFTR-B values for ΔF and ΔF/DAA were expressed as the fraction of each in the sum of the two. **p ≤ 0.01. (D–F) HEK293 cells stably expressing DAA (D), ΔF (E), or ΔF/DAA (F) CFTR were cultured at 37°C for over 24 h followed by incubation at 30°C for the indicated time periods. Cell lysates were immunoblotted for CFTR. For each individual cell line, CFTR levels in bands B and C were quantified, normalized to actin, and then normalized to the value of band B at time 0. (G–H) In situ limited proteolysis was performed on microsomes prepared from HEK293 cells stably expressing ΔF or ΔF/DAA and probed with MM13-4 (G) and M3A7 (H).
Figure 7.
Figure 7.
R555K improves export and post-ER stability of ΔF508 CFTR. (A) HEK293 cells were transiently transfected with ΔF, ΔF/R29K, ΔF/R555K and ΔF/R29K/R555K (ΔF/2RK) and cultured at 37°C for 20 h (37°C), or further switched to 30°C and incubated for an additional 16 h (30°). Cell lysates were immunoblotted for CFTR and actin. The level of CFTR in bands B and C was quantified, normalized to actin. The percentage of band C of total (C%) was calculated for each construct, and the means and SEMs were plotted. n = 3. (B) HEK293 cells were transiently transfected with ΔF, ΔF/R555K and ΔF/R555K/DAA CFTR. Transfected cells were incubated at 37°C for 20 h (37°C), or further switched to 30°C and incubated for an additional 16 h at 30°C (30°C) before the cells were lysed. The cell lysates were immunoblotted for CFTR and actin. The quantification of bands and calculation of C% are as described above. n = 3. (C) HEK293 cells were transiently transfected with ΔF or ΔF/R555K CFTR and incubated at 37°C for the indicated time. Cell lysates were immunoblotted for CFTR and actin. Quantification of CFTR in bands B and C was performed as described in Figure 1C. Two independent time courses for each were performed. The representative immunoblotting images are shown on the top, and the means and SEMs are plotted below. (D) CHX chase on HEK293 cells stably expressing ΔF and ΔF/R555K was performed and quantified as described in Figure 2. (E) HEK293 cells were transiently transfected with ΔF or ΔF/R555K. Twenty hours after transfection, the cells were lysed, and quantitative coimmunoprecipitation was conducted as described in Figure 6C. Representative immunoblots are shown on the top, and the means and SEMs of seven experiments are represented in the chart below. **p ≤ 0.01.
Figure 8.
Figure 8.
Low temperature and R555K promote the conformational maturation of ΔF508 CFTR in HEK293 cells. (A) Microsomes prepared from HEK293 cells stably expressing the indicated CFTR constructs were subjected to trypsin digestion at increasing concentrations as described in Figure 3. For ΔF, 30°C and ΔF/R555K, 30°C, cells were incubated at 30°C for 16 h before the preparation of microsomes. The digestion mixtures were immunoblotted with CFTR mAb MM13-4 (a–e) or M3A7 (f–j). (B) The ∼50-kDa bands in A, a–e, were quantified as described above.
Figure 9.
Figure 9.
The cell line-dependent temperature rescue of ΔF508 correlates with global conformational reversion in CFTR. (A) HEK293 (HEK) and BHK cells were transiently transfected with ΔF508 CFTR. After incubation at 37°C for over 24 h, the cells were either maintained at 37°C, or shifted to 30°C and incubated for another 16 h (30°C). The BHK-ΔF cells were cultured at 37°C for over 24 h before it was either maintained at the same temperature (37°C) or shifted to 30°C and incubated for another 16 h (30°C). The cells were lysed, and lysates were immunoblotted for CFTR. CFTR level in bands B and C were quantified, and C% was calculated as described above. (B) In situ limited proteolysis was conducted on microsomes prepared from the indicated BHK stable cell lines as described in Figures 3. For BHK-ΔF, 30°C, BHK-ΔF cells were incubated at 30°C for 16 h before microsome preparation. The trypsin digestion mixtures were probed with CFTR mAb MM13-4 (a–d) or M3A7 (e–h). (C) The ∼50-kDa bands in B, a–d, were quantified as described above.

Similar articles

Cited by

References

    1. Aridor M., Weissman J., Bannykh S., Nuoffer C., Balch W. E. Cargo selection by the COPII budding machinery during export from the ER. J. Cell Biol. 1998;141:61–70. - PMC - PubMed
    1. Barlowe C., Orci L., Yeung T., Hosobuchi M., Hamamoto S., Salama N., Rexach M. F., Ravazzola M., Amherdt M., Schekman R. COPII: a membrane coat formed by Sec proteins that drive vesicle budding from the endoplasmic reticulum. Cell. 1994;77:895–907. - PubMed
    1. Carlile G. W., Robert R., Zhang D., Teske K. A., Luo Y., Hanrahan J. W., Thomas D. Y. Correctors of protein trafficking defects identified by a novel high-throughput screening assay. Chembiochemistry. 2007;8:1012–1020. - PubMed
    1. Chang X. B., Cui L., Hou Y. X., Jensen T. J., Aleksandrov A. A., Mengos A., Riordan J. R. Removal of multiple arginine-framed trafficking signals overcomes misprocessing of delta F508 CFTR present in most patients with cystic fibrosis. Mol. Cell. 1999;4:137–142. - PubMed
    1. Chen E. Y., Bartlett M. C., Loo T. W., Clarke D. M. The DeltaF508 mutation disrupts packing of the transmembrane segments of the cystic fibrosis transmembrane conductance regulator. J. Biol. Chem. 2004;279:39620–39627. - PubMed

Publication types

MeSH terms

Substances

LinkOut - more resources