. 2010 Mar 5;285(10):7670-85.
doi: 10.1074/jbc.M109.090175. Epub 2009 Dec 23.

Control of steroid 21-oic acid synthesis by peroxisome proliferator-activated receptor alpha and role of the hypothalamic-pituitary-adrenal axis

Affiliations

Control of steroid 21-oic acid synthesis by peroxisome proliferator-activated receptor alpha and role of the hypothalamic-pituitary-adrenal axis

Ting Wang et al. J Biol Chem. .

Abstract

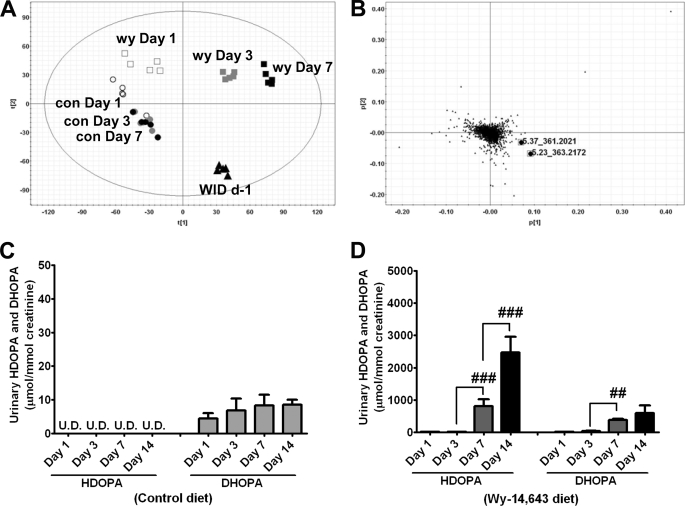
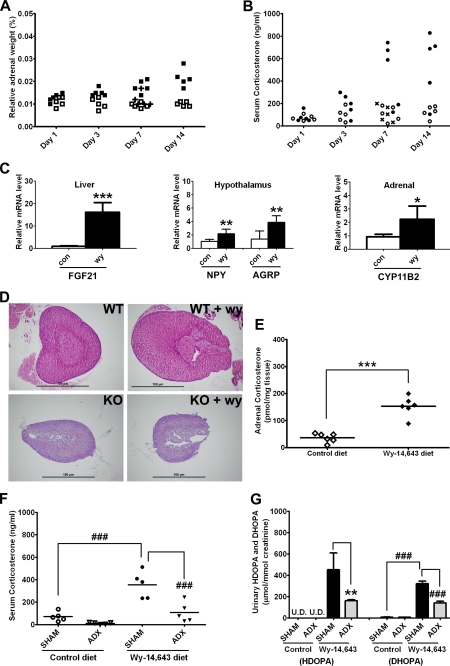
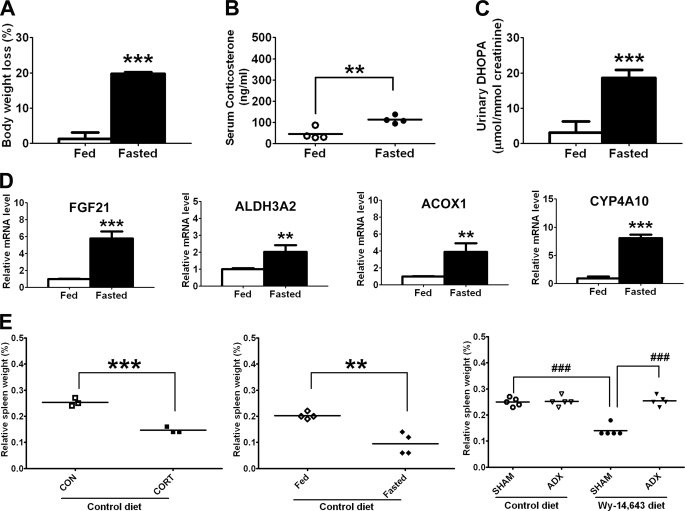
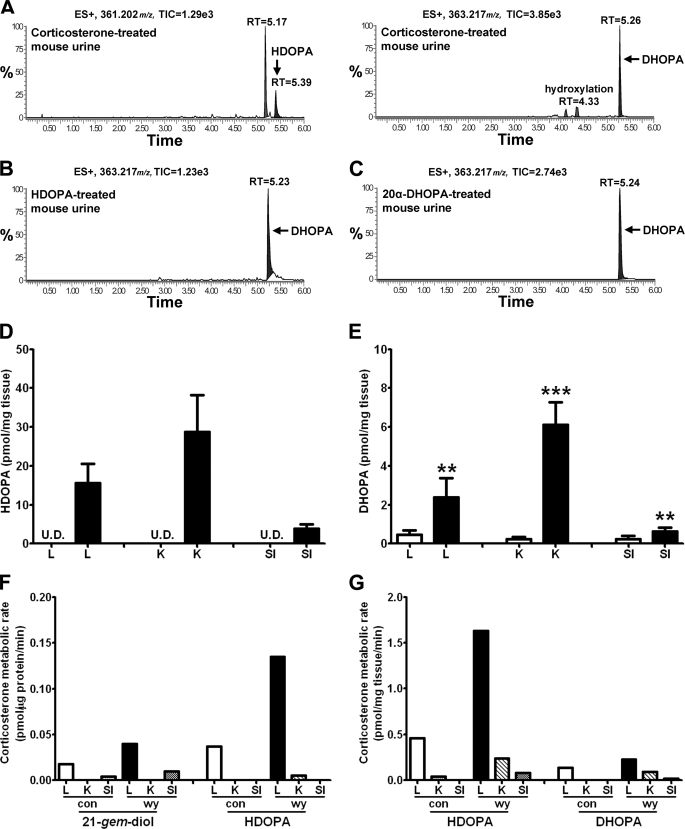
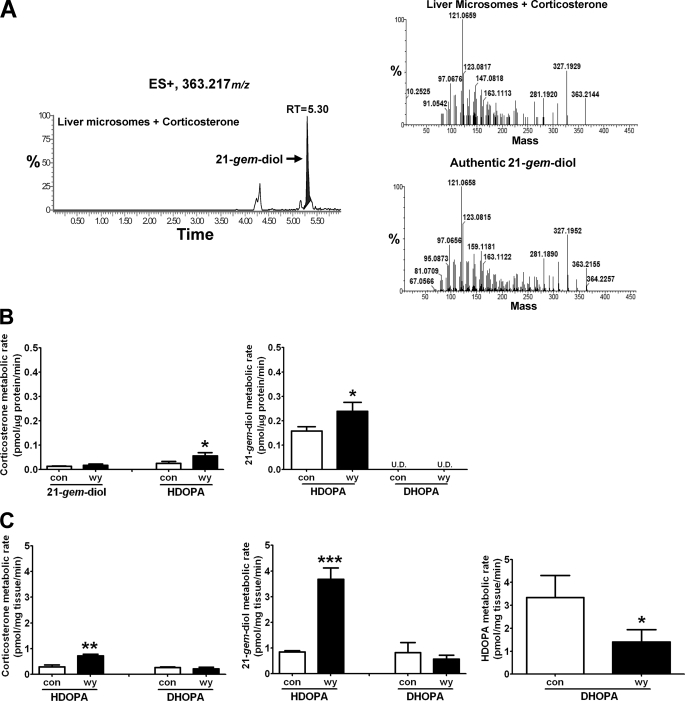
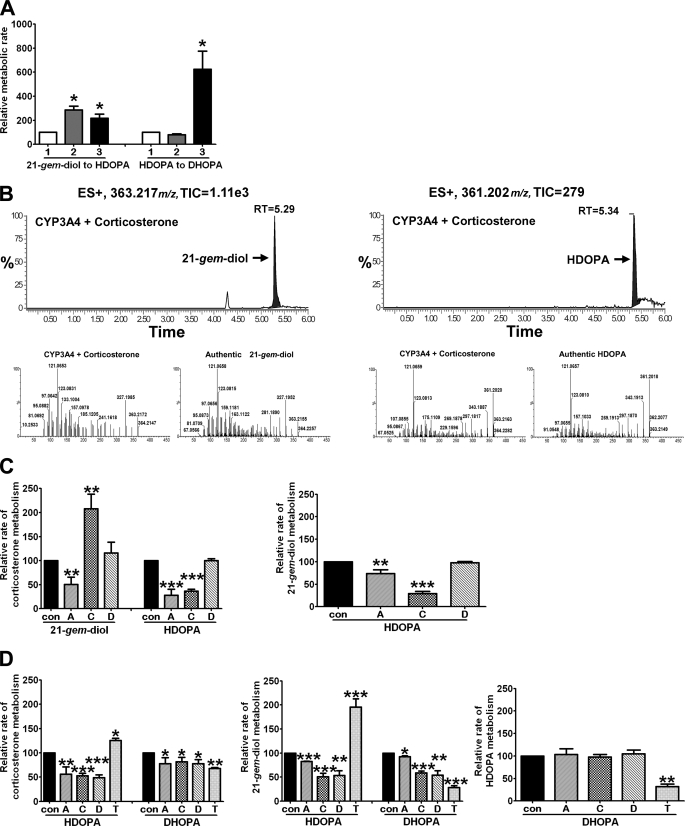
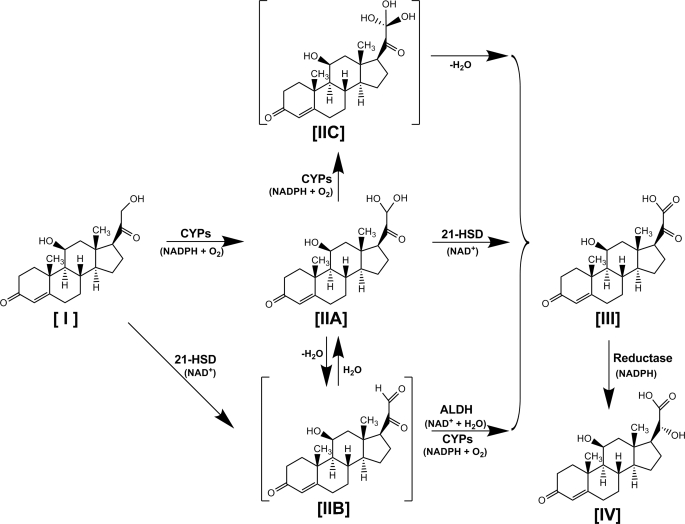
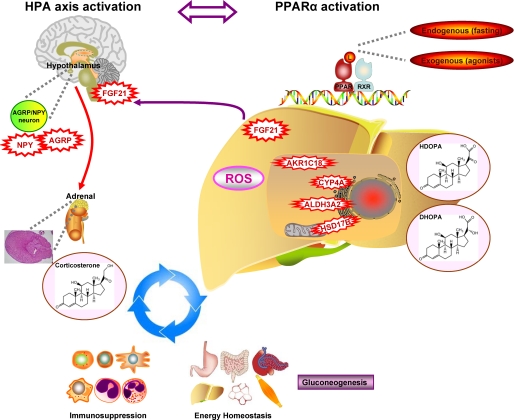
A previous study identified the peroxisome proliferator-activated receptor alpha (PPARalpha) activation biomarkers 21-steroid carboxylic acids 11beta-hydroxy-3,20-dioxopregn-4-en-21-oic acid (HDOPA) and 11beta,20-dihydroxy-3-oxo-pregn-4-en-21-oic acid (DHOPA). In the present study, the molecular mechanism and the metabolic pathway of their production were determined. The PPARalpha-specific time-dependent increases in HDOPA and 20alpha-DHOPA paralleled the development of adrenal cortex hyperplasia, hypercortisolism, and spleen atrophy, which was attenuated in adrenalectomized mice. Wy-14,643 activation of PPARalpha induced hepatic FGF21, which caused increased neuropeptide Y and agouti-related protein mRNAs in the hypothalamus, stimulation of the agouti-related protein/neuropeptide Y neurons, and activation of the hypothalamic-pituitary-adrenal (HPA) axis, resulting in increased adrenal cortex hyperplasia and corticosterone production, revealing a link between PPARalpha and the HPA axis in controlling energy homeostasis and immune regulation. Corticosterone was demonstrated as the precursor of 21-carboxylic acids both in vivo and in vitro. Under PPARalpha activation, the classic reductive metabolic pathway of corticosterone was suppressed, whereas an alternative oxidative pathway was uncovered that leads to the sequential oxidation on carbon 21 resulting in HDOPA. The latter was then reduced to the end product 20alpha-DHOPA. Hepatic cytochromes P450, aldehyde dehydrogenase (ALDH3A2), and 21-hydroxysteroid dehydrogenase (AKR1C18) were found to be involved in this pathway. Activation of PPARalpha resulted in the induction of Aldh3a2 and Akr1c18, both of which were confirmed as target genes through introduction of promoter luciferase reporter constructs into mouse livers in vivo. This study underscores the power of mass spectrometry-based metabolomics combined with genomic and physiologic analyses in identifying downstream metabolic biomarkers and the corresponding upstream molecular mechanisms.


Figures

FIGURE 1.
FIGURE 1.
Metabolomic analysis of mouse urine identifies HDOPA and 20α-DHOPA as time-dependent biomarkers of PPARα activation. A, PCA scores plot of component 1 versus component 2 for seven groups of urine samples from wild-type mice (C57BL/6Nr background), fed either control diet (con, ○) or Wy-14,643 diet (wy, □) at day 1 (white symbols), day 3 (gray symbols), day 7 (black symbols), and 1-day withdrawal from WY after 1 week of WY diet administration (WID d-1, ▴) (n = 5). B, PCA loading plot showing that HDOPA (m/z = 361.202+ at 5.37 min) and 20α-DHOPA (m/z = 363.217+ at 5.23 min) contributed to the separation between control and WY-fed groups (n = 5). Time course urinary levels of HDOPA and 20α-DHOPA in mice fed a control (C) or a WY (D) diet (n = 5). Each data bar in this figure represents the mean ± S.D. DHOPA, 20α-DHOPA; U.D., undetectable. The group differences are shown with significance values of p < 0.01 (##) and p < 0.001 (###) for one-way ANOVA.
FIGURE 2.
FIGURE 2.
Activation of HPA axis by PPARα ligands and the attenuation of HDOPA and 20α-DHOPA production by adrenalectomy. A, time course relative adrenal weight (percentage of body weight) of wild-type mice (C57BL/6Nr background) fed either control diet (□) or WY diet (■), or withdrawal from WY for 2 days (WID) after 1 week of WY diet administration (+), 0.013% (wy) versus 0.011% (con), p > 0.5 at day 1; 0.015% (wy) versus 0.010% (con), p < 0.01 at day 3; 0.018% (wy) versus 0.009% (con), p < 0.001 at 1-week; and 0.022% (wy) versus 0.010% (con), p < 0.001 at 2-weeks of WY treatment, 0.012% (WID) versus 0.018% (wy) at 1-week, p < 0.05 (n = 5). B, time course serum corticosterone level (ng/ml) of wild-type mice fed either control diet (○) or WY diet (●) or withdrawal from WY for 2 days after 1 week of WY diet administration (×), determined by ELISA kit, 79.8 (wy) versus 71.9 (con) ng/ml, p > 0.5 at day 1; 190.0 (wy) versus99.5 (con) ng/ml, p > 0.5 at day 3; 463.9 (wy) versus 108.0 (con) ng/ml, p < 0.05 at 1-week; and 543.8 (wy) versus 126.2 (con) ng/ml, p < 0.05 at 2-weeks of WY treatment, 111.0 ng/ml (WID) versus 463.9 (wy) ng/ml at 1-week, p < 0.05 (n = 5). C, relative mRNA levels of FGF21 in livers, NPY and AGRP in hypothalamus, and CYP11B2 in adrenal glands of wild-type mice fed control (white bars) or WY (black bars) diet for 2 weeks, determined by qPCR (n = 6). D, representative histology sections of adrenal glands from wild-type (WT) and Ppara-null (KO) mice (both C57BL/6Nr background) fed control or WY diet for 2 weeks (magnification, 40×). E, adrenal corticosterone levels (pmol/mg tissue) of wild-type mice fed control diet (◇) or WY diet (♦) for 2 weeks, determined by UPLC-TOFMS (n = 6). Adrenalectomy and the control sham surgery were performed on wild-type mice, and either control or WY diet was given to both groups 1 week after the surgery. Serum and urine samples were collected at day 7 of diet administration. F, serum corticosterone level (ng/ml) of SHAM and ADX mice fed control or WY diet, determined by ELISA kit (n = 5). G, urinary HDOPA and 20α-DHOPA levels (μmol/mmol creatinine) of SHAM and ADX mice fed control or WY diet, determined by UPLC-TOFMS (n = 5). Each data bar in this figure represents the mean ± S.D., and the data points are given as individuals or individuals with mean. DHOPA, 20α-DHOPA. The group differences are shown with significance values of p < 0.05 (*), p < 0.01 (**), and p < 0.001 (***) for Student's t test and p < 0.001 (###) for one-way ANOVA.
FIGURE 3.
FIGURE 3.
Confirmation of increases in urinary 20α-DHOPA during fasting. A–C, body weight loss (A), serum corticosterone level (B), and urinary 20α-DHOPA level (C) in wild-type mice fed control diet or fasted for 24 h (n = 4). D, hepatic mRNA levels of FGF21, ALDH3A2, ACOX1, and CYP4A10 in fed or fasted mice (n = 4). E, spleen weight (percentage of body weight) of vehicle corn oil (CON) or corticosterone (CORT, 10 mg/kg) treated mice (left panel, n = 3), fed or fasted mice (middle panel, n = 4), or SHAM or adrenalectomized (ADX) mice (right panel, n = 5). Each data bar in this figure represents the mean ± S.D., and the data points are given as individuals with mean. DHOPA, 20α-DHOPA. The group differences are shown with significance values p < 0.01 (**) and p < 0.001 (***) for Student's t test and p < 0.001 (###) for one-way ANOVA.
FIGURE 4.
FIGURE 4.
Identification of corticosterone as the precursor and liver as the major organ in the metabolic pathway forming HDOPA and 20α-DHOPA. Wild-type mice (C57BL/6Nr background) were treated with either vehicle, or corticosterone, or HDOPA, or 20α-DHOPA at the dose of 10 mg/kg via gavage. Urine samples were collected during the first 24 h after the treatment. The samples were extracted and analyzed by UPLC-TOFMS. The mass spectra from treated urine samples were compared with those with vehicle-treated urine samples using MetaboLynx software to find potential metabolites. Each metabolite was represented as extracted ion chromatograms (window of 50 mDa), and mass, total ion currents (TIC), retention time (RT), putative metabolic reaction name, mass difference were discerned automatically by MetaboLynx. The accurate MS/MS spectra and retention time were compared with the authentic standards to confirm the structure. A, in vivo metabolites of corticosterone identified as HDOPA (m/z = 361.202+ at 5.39 min) and 20α-DHOPA (m/z = 363.217+ at 5.26 min). B, in vivo metabolite of HDOPA identified as the reductive metabolite 20α-DHOPA (m/z = 363.217+ at 5.23 min). C, 20α-DHOPA was eliminated from the body as the parent form (m/z = 363.217+ at 5.24 min). D and E, distributions (pmol/mg tissue) of HDOPA (D) and 20α-DHOPA (E) in livers (L), kidneys (K), and small intestines (SI) of wild-type mice fed control (white bar) or WY (black bar) diet for 1 week, determined by UPLC-TOFMS (n = 6). F and G, activities of tissue microsomes (F, pmol/μg protein/min) and tissue homogenates (G, pmol/mg tissue/min) in the metabolism of corticosterone, determined by UPLC-TOFMS (n = 1). Each data bar in this figure represents the individual value or the mean ± S.D. DHOPA, 20α-DHOPA; U.D., undetectable. The group differences are shown with significance values of p < 0.01 and p < 0.001 (***).
FIGURE 5.
FIGURE 5.
Identification of 21-gem-diol as the intermediate in the metabolic pathway forming HDOPA and 20α-DHOPA. Wild-type mice were fed control or WY diet for 1 week before collecting livers. Liver microsomes and homogenates were prepared and analyzed by UPLC-TOFMS. In metabolic studies, 50 μm of corticosterone, 21-gem-diol, HDOPA, and 20α-DHOPA were incubated separately with liver microsomes or homogenates for 30 min. The mass spectra from incubation samples including both tissue and substrate were compared with the incubation solution with only the substrate using MetaboLynx to find potential metabolites. The concentration of each metabolite was obtained from QuanLynx using debrisoquine as internal standard. A, chromatogram of a corticosterone metabolite produced from liver microsomes (left panel), whose MS/MS spectrum (right top panel) and retention time (m/z = 363.217+ at 5.30 min) matched that of authentic 21-gem-diol standard (right bottom panel). B, the activities of liver microsomes in the metabolism of corticosterone (left) and 21-gem-diol (right panel) (n = 3). C, the activities of liver homogenates in the metabolism of corticosterone (left panel), 21-gem-diol (middle panel), and HDOPA (right panel) (n = 3). Each data bar in this figure represents the mean ± S.D. DHOPA, 20α-DHOPA; U.D., undetectable. The group differences are shown with significance values of p < 0.05 (*), p < 0.01 (**), and p < 0.001 (***).
FIGURE 6.
FIGURE 6.
Identification of oxidase encoding genes Aldh3a2 and Akr1c18 as PPARα targets. Relative mRNA levels of ALDH3A2 (A) and AKR1C18 (B) in livers of wild-type (WT, n = 5), Ppara-null (KO, n = 4), and PPARα-humanized (PAC, n = 4) mice, determined by qPCR. In vivo luciferase activity by bioluminescent imaging were measured in wild-type mice (FVB/NJ background) (C), Ppara-null mice (Sv129 background) (D), and Sv129 wild-type mice (E) 48 h after hydrodynamic tail vein injection of 40 μg of Ppre-luc (Ppre), pGL3-Aldh3a2-luc (Aldh3a2), pGL3-Akr1c18-luc (Akr1c18), and pGL3-luc (pGL3) plasmid vectors, and 24 h following either control (−) or WY (+) diet administration. C–E, hepatic DNA copies of hydrodynamic injected vectors and the housekeeping gene Gapdh in individual mouse, demonstrated through PCR using RV3-GL2 primer and Gapdh primer respectively. Each data bar in this figure represents the mean ± S.D. The group differences are shown with significance values of p < 0.01 (**) and p < 0.001 (***) for Student's t test and p < 0.05 (#), p < 0.01 (##), and p < 0.001 (###) for one-way ANOVA. N.S. represents no statistical difference.
FIGURE 7.
FIGURE 7.
Involvement of CYPs, ALDH, and 21-HSD in the oxidation pathway of corticosterone metabolism. Wild-type mice (C57BL/6Nr background) were fed a WY diet for 1 week before collecting livers. The samples were prepared and analyzed by UPLC-TOFMS. A, effects of cofactor NAD+ (gray bar, 2), or NADPH (black bar, 3) on the activities of liver homogenates in the metabolism of 21-gem-diol and HDOPA compared with vehicle control (white bar, 1) (n = 3). B, corticosterone metabolites from recombinant human CYP3A4 identified as 21-gem-diol (left panels) and HDOPA (right panels) by chromatograms (top panels) and MS/MS spectra (bottom panels). C, inhibition on the activities of liver microsomes in the metabolism of corticosterone (left panel) and 21-gem-diol (right panel) (n = 3). D, inhibition on the activities of liver homogenates in the metabolism of corticosterone (left panel), 21-gem-diol (middle panel), and HDOPA (right panel) (n = 3). Vehicle or different inhibitors, CYPs suicide inhibitor 1-aminobenzotriazole (100 μm, bar A), ALDH inhibitor cyanamide (200 μm, bar C), AKR1C1 inhibitor 3, 5-dichlorosalicylic acid (5 μm, bar D), and catalase (750 units/ml, bar T) were added into the incubation system 10 min before the addition of substrates. Each data bar in this figure represents the mean ± S.D. TIC, total ion current; RT, retention time; DHOPA, 20α-DHOPA. The group differences between vehicle control and treatments are shown with significance values of p < 0.05 (*), p < 0.01 (**), and p < 0.001 (***).
FIGURE 8.
FIGURE 8.
Proposed metabolic model for the formation of two carboxylic acids HDOPA [III] and 20α-DHOPA [IV] from corticosterone [I] via its aldehyde hydrate [IIA] and putative intermediates corticosterone aldehyde [IIB], 21-gem-triol [IIC]. CYPs (a panel of CYPs, especially the major liver enzyme CYP3A subfamily, and the PPARα-induced CYP4A subfamily), ALDH (PPARα specific induced ALDH3A2, possibly coincided with other PPARα-induced ALDH family members), and 21-HSD (PPARα-induced AKR1C18, possibly coincided with PPARα-induced HSD17B) are involved in the multi-step oxidation.
FIGURE 9.
FIGURE 9.
Reciprocal roles between PPARα activation and HPA axis activation in stimulation of gluconeogenesis, suppression of immune responses, and the production of 21-carboxylic acids. Red represents stress (reactive oxygen species (ROS)), enzymes (CYP4A, ALDH3A2, AKR1C18, and HSD17B), growth factor (FGF21), and neuropeptides (NPY and AGRP) induced by PPARα ligands (L). Purple indicates metabolic process (gluconeogenesis) stimulated under the crosstalk between PPARα activation and HPA axis activation.

Similar articles

Cited by

References

    1. Desvergne B., Wahli W. (1999) Endocr. Rev. 20, 649–688 - PubMed
    1. Inagaki T., Dutchak P., Zhao G., Ding X., Gautron L., Parameswara V., Li Y., Goetz R., Mohammadi M., Esser V., Elmquist J. K., Gerard R. D., Burgess S. C., Hammer R. E., Mangelsdorf D. J., Kliewer S. A. (2007) Cell Metab. 5, 415–425 - PubMed
    1. Zhen Y., Krausz K. W., Chen C., Idle J. R., Gonzalez F. J. (2007) Mol. Endocrinol. 21, 2136–2151 - PMC - PubMed
    1. Nicholson J. K., Lindon J. C., Holmes E. (1999) Xenobiotica 29, 1181–1189 - PubMed
    1. Griffin J. L. (2006) Philos. Trans. R. Soc. Lond. B Biol. Sci. 361, 147–161 - PMC - PubMed

Publication types

MeSH terms