. 2010 Feb 26;285(9):6693-705.
doi: 10.1074/jbc.M109.084293. Epub 2009 Dec 23.

Spontaneous development of endoplasmic reticulum stress that can lead to diabetes mellitus is associated with higher calcium-independent phospholipase A2 expression: a role for regulation by SREBP-1

Affiliations

Spontaneous development of endoplasmic reticulum stress that can lead to diabetes mellitus is associated with higher calcium-independent phospholipase A2 expression: a role for regulation by SREBP-1

Xiaoyong Lei et al. J Biol Chem. .

Abstract

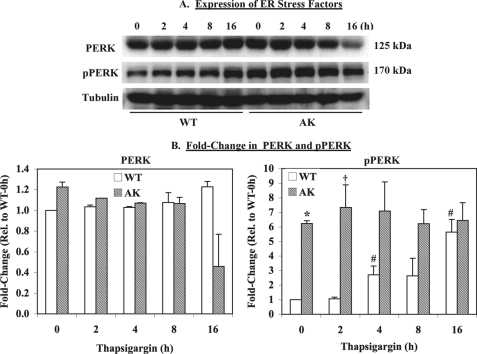
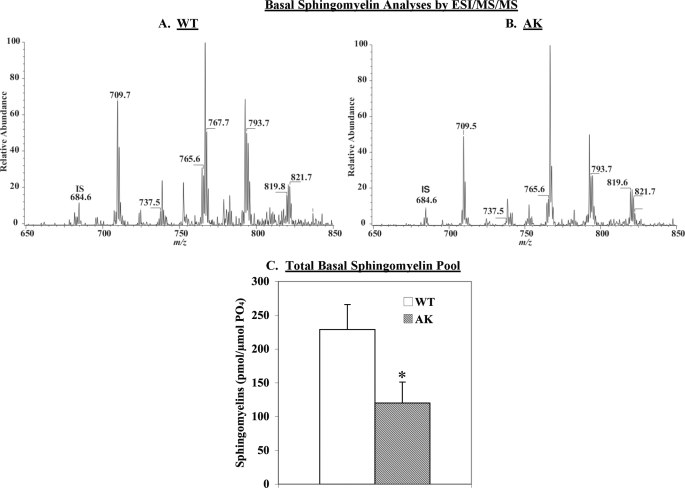
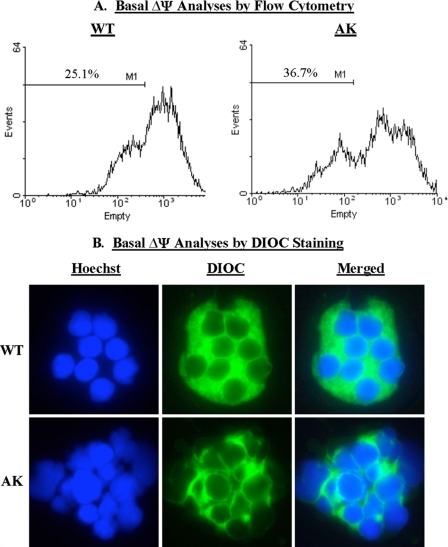
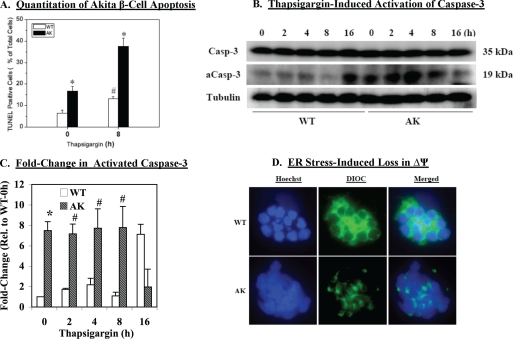
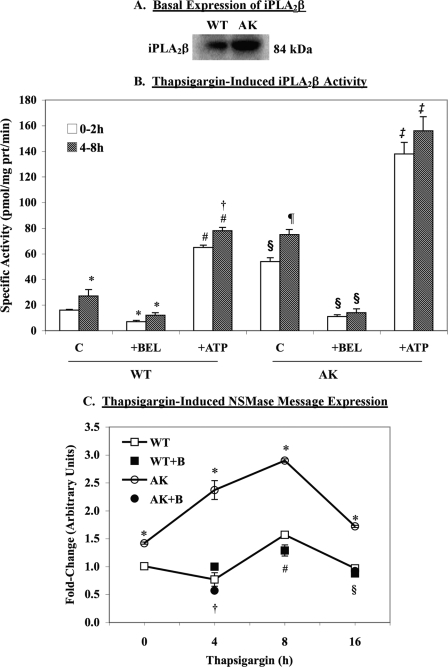
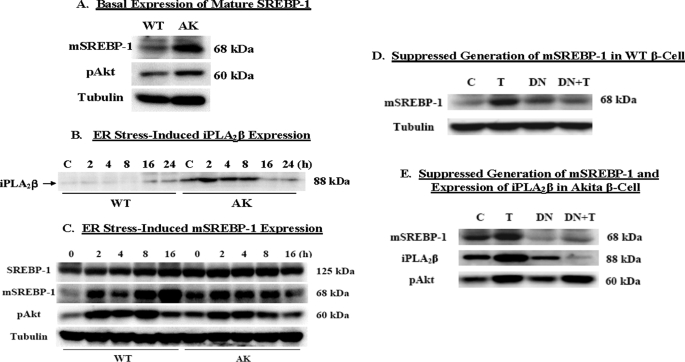
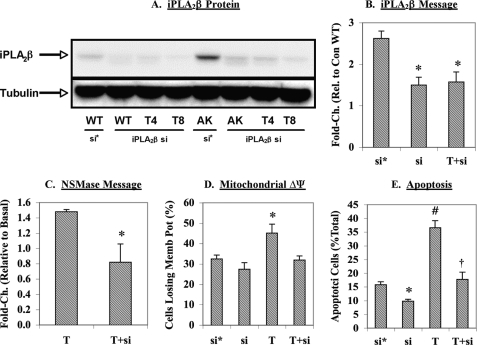
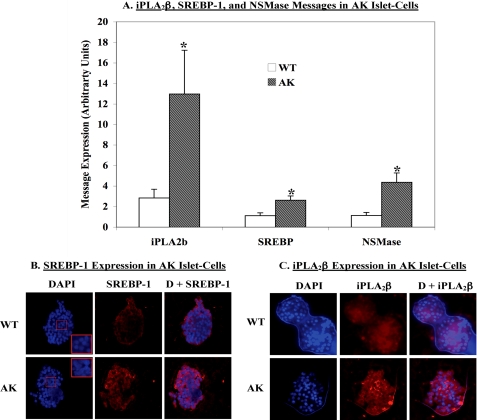
Our recent studies indicate that endoplasmic reticulum (ER) stress causes INS-1 cell apoptosis by a Ca(2+)-independent phospholipase A(2) (iPLA(2)beta)-mediated mechanism that promotes ceramide generation via sphingomyelin hydrolysis and subsequent activation of the intrinsic pathway. To elucidate the association between iPLA(2)beta and ER stress, we compared beta-cell lines generated from wild type (WT) and Akita mice. The Akita mouse is a spontaneous model of ER stress that develops hyperglycemia/diabetes due to ER stress-induced beta-cell apoptosis. Consistent with a predisposition to developing ER stress, basal phosphorylated PERK and activated caspase-3 are higher in the Akita cells than WT cells. Interestingly, basal iPLA(2)beta, mature SREBP-1 (mSREBP-1), phosphorylated Akt, and neutral sphingomyelinase (NSMase) are higher, relative abundances of sphingomyelins are lower, and mitochondrial membrane potential (DeltaPsi) is compromised in Akita cells, in comparison with WT cells. Exposure to thapsigargin accelerates DeltaPsi loss and apoptosis of Akita cells and is associated with increases in iPLA(2)beta, mSREBP-1, and NSMase in both WT and Akita cells. Transfection of Akita cells with iPLA(2)beta small interfering RNA, however, suppresses NSMase message, DeltaPsi loss, and apoptosis. The iPLA(2)beta gene contains a sterol-regulatory element, and transfection with a dominant negative SREBP-1 reduces basal mSREBP-1 and iPLA(2)beta in the Akita cells and suppresses increases in mSREBP-1 and iPLA(2)beta due to thapsigargin. These findings suggest that ER stress leads to generation of mSREBP-1, which can bind to the sterol-regulatory element in the iPLA(2)beta gene to promote its transcription. Consistent with this, SREBP-1, iPLA(2)beta, and NSMase messages in Akita mouse islets are higher than in WT islets.


Figures

FIGURE 1.
FIGURE 1.
Basal expression of ER stress factors and apoptotic factors. WT and AK β-cells were harvested at various times after exposure to thapsigargin (0.50 μm), and 30 μg of lysate protein was processed for immunoblotting analyses for PERK and pPERK. Tubulin was used as a loading control. These analyses were done three separate times. A, immunoblot. A representative blot for PERK and pPERK is presented. B, densitometry. The ratios of PERK- and pPERK-immunoreactive bands to the corresponding tubulin band were determined, and means ± S.E. of -fold change relative to WT at 0 h are presented. * and †, significantly different from corresponding WT, p < 0.001 and p < 0.05, respectively. #, significantly different from WT at 0 h, p < 0.05.
FIGURE 2.
FIGURE 2.
Sphingomyelin analyses by ESI/MS/MS. Phospholipids were extracted from WT and AK β-cells, and the abundances of sphingomyelin molecular species were analyzed by ESI/MS/MS in the presence of 14:0/14:0-GPC (m/z 684) internal standard. The WT (A) and AK (B) spectra were obtained by monitoring constant neutral loss of 59. C, total sphingomyelin pool. Content of each sphingomyelin molecular species (pmol) was determined in each group and normalized to total phosphate (μmol of PO4). The means ± S.E. (n = 3) of the total (pmol/μmol of PO4) sphingomyelin pools are presented. *, AK group significantly different from WT, p < 0.05.
FIGURE 3.
FIGURE 3.
Basal mitochondrial membrane potential (ΔΨ) monitoring. ΔΨ was monitored in WT and AK β-cells by flow cytometry and DiOC6(3) staining. A, flow cytometry. The spectra reflect fluorescence measurement in 10,000 cells, and the percentage of cells losing ΔΨ is indicated as M1. These analyses were done four separate times. B, DiOC6(3) staining. Cells were loaded with the blue nuclear (Hoechst; left panels) and green mitochondrial (DiOC6(3) (DIOC); middle panels) stain and examined by confocal microscopy. The merged images are shown in the right panels.
FIGURE 4.
FIGURE 4.
Assessment of apoptosis and mitochondrial membrane potential (ΔΨ) in Akita β-cells. WT and AK β-cells were exposed to DMSO (control) or thapsigargin (T) (0.50 μm) and harvested at various times for analyses. A, apoptosis quantitation. Total cell number was determined using DAPI nuclear stain, and the mean ± S.E. (n = 3) percentages of TUNEL-positive apoptotic cells are presented. *, AK group significantly different from WT, p < 0.05. #, WT treated group significantly different from WT control group, p < 0.05. B, caspase-3 activation. Cell lysates were prepared and processed for full-length and activated caspase-3 (Casp-3 and aCasp-3, respectively) immunoblotting analyses. Tubulin was used as a loading control. These analyses were done three separate times. C, activated caspase-3 densitometry. The ratio of the activated caspase-3-immunoreactive band to the corresponding tubulin band was determined, and means ± S.E. of -fold change relative to WT at 0 h are presented. * and #, significantly different from corresponding WT; p < 0.01 and p < 0.05, respectively. D, ΔΨ analyses. Following exposure to DMSO or thapsigargin for 8 h, the WT and AK β-cells were loaded with the blue nuclear (Hoechst) (left panels) and green mitochondrial (DiOC6(3)) (DIOC) (middle panels) stains and examined by confocal microscopy. The merged images are shown in the right panels.
FIGURE 5.
FIGURE 5.
Basal and ER stress-induced expression of iPLA2β and NSMase. A, iPLA2β protein. Cell lysates were prepared from WT and AK β-cells, and 30-μg protein aliquots were processed for immunoblotting analyses. B, iPLA2β activity. Cytosol was prepared from control or thapsigargin-treated (0.50 μm) AK cells, and iPLA2β catalytic activity was assayed in 25 μg of cytosolic protein in the absence and presence of ATP (10 mm) or BEL (1 μm). Means ± S.E. (n = 6–8) of specific activity (pmol/mg protein/min) are presented. *, WT 4–8 h significantly different from WT 0–2 h and WT with BEL significantly different from corresponding WT without BEL, p < 0.05. #, WT with ATP significantly different from corresponding WT without ATP, p < 0.0001. †, WT with ATP 4–8 h significantly different from WT 0–2 h, p < 0.005. §, AK 0–2 h significantly different from WT 0–2 h and AK with BEL significantly different from corresponding AK without BEL, p < 0.0001. ¶, AK 4–8 h significantly different from AK 0–2 h, p < 0.001. ‡, AK with ATP significantly different from AK without ATP, p < 0.00001. C, NSMase message. Total RNA was isolated from DMSO- or thapsigargin-treated (0–16 h) WT and AK β-cells, and qRT-PCR analyses were performed for NSMase. In some experiments, the cells were treated with BEL (+B) (1 μm) for 30 min, washed, and then exposed to thapsigargin. Means ± S.E. (n = 5–6) of the -fold increase in message are presented. 18 S was used as a housekeeping control. *, AK significantly different from corresponding WT, p < 0.0005. †, AK with BEL significantly different from AK, p < 0.001. #, WT with BEL significantly different from WT, p < 0.05. §, AK with BEL significantly different from AK, p < 0.05.
FIGURE 6.
FIGURE 6.
SREBP-1 expression and SREBP-1-induced activation of iPLA2β. WT and AK β-cells were exposed to DMSO (Control) or thapsigargin (T) (0.50 μm) and harvested at various times, and 30-μg protein aliquots were processed for immunoblotting analyses. A, basal mSREBP-1 expression. B, thapsigargin-induced iPLA2β expression. C, thapsigargin-induced mSREBP-1 expression. DN SREBP-1 was expressed in WT and AK β-cells and treated with DMSO or thapsigargin (0.50 μm) for 8 h. Cell lysates were then prepared, and 30-μg protein aliquots were processed for immunoblotting analyses for mSREBP-1 and iPLA2β. D, mSREBP-1 in WT β-cells. E, mSREBP-1 and iPLA2β in Akita β-cells. Tubulin was used as a loading control. These analyses were done 3–5 separate times.
FIGURE 7.
FIGURE 7.
Effects of iPLA2β knockdown on NSMase induction, mitochondrial membrane potential loss, and apoptosis in Akita cells. Wild type and Akita cells were transfected with either control siRNA (si*) or iPLA2β siRNA (si) and subsequently treated with DMSO vehicle or thapsigargin (T) (1 μm). The cells were harvested at 8 h for various experimental protocols, each done 3–5 times. A, iPLA2β protein. Cell lysates were prepared, and 30-μg protein aliquots were processed for immunoblotting. B, iPLA2β message. Total RNA was prepared, and cDNA was generated for qRT-PCR of iPLA2β message. *, significantly different from the control siRNA group, p < 0.01. C, NSMase message. Total RNA was prepared, and cDNA was generated for qRT-PCR of NSMase message. *, significantly different from the thapsigargin group, p < 0.05. D, mitochondrial membrane potential. The percentage of cells losing ΔΨ was determined using the flow cytometry protocol as described for Fig. 3. *, significantly different from all other groups, p < 0.05. E, apoptosis. The incidence of cell death was assessed using the TUNEL assay. *, iPLA2β siRNA group significantly different from the control siRNA group, p < 0.001. #, thapsigargin group significantly different from the control siRNA group, p < 0.0001. †, thapsigargin plus iPLA2β siRNA group significantly different from the thapsigargin group, p < 0.005. The means ± S.E. for each measurement are presented in B–E.
FIGURE 8.
FIGURE 8.
iPLA2β, SREBP-1, and NSMase message and iPLA2β and SREBP-1 protein expression in Akita mouse islets. Islets were isolated from WT and Akita mice at 4 weeks of age. Total RNA was prepared, and qRT-PCR analyses for iPLA2β, SREBP-1, and NSMase were performed. Means ± S.E. (n = 3–5) of the -fold increase in each message are presented (A). 18 S was used as a control. *, AK group significantly different from corresponding WT group, p < 0.05. B and C, paraffin sections (10 μm) of islets isolated from WT and AK mice at ∼4 weeks of age were prepared and stained for cell nuclei (DAPI) (blue) and SREBP-1 (red in B) or iPLA2β (red in C), and fluorescence was recorded using a Nikon Eclipse TE300 microscope. The insets in B are magnifications of islet cell nuclei.

References

    1. Klöppel G., Löhr M., Habich K., Oberholzer M., Heitz P. U. (1985) Surv. Synth. Pathol. Res. 4, 110–125 - PubMed
    1. Stefan Y., Orci L., Malaisse-Lagae F., Perrelet A., Patel Y., Unger R. H. (1982) Diabetes 31, 694–700 - PubMed
    1. Butler A. E., Janson J., Bonner-Weir S., Ritzel R., Rizza R. A., Butler P. C. (2003) Diabetes 52, 102–110 - PubMed
    1. Yoon K. H., Ko S. H., Cho J. H., Lee J. M., Ahn Y. B., Song K. H., Yoo S. J., Kang M. I., Cha B. Y., Lee K. W., Son H. Y., Kang S. K., Kim H. S., Lee I. K., Bonner-Weir S. (2003) J. Clin. Endocrinol. Metab. 88, 2300–2308 - PubMed
    1. Araki E., Oyadomari S., Mori M. (2003) Exp. Biol. Med. (Maywood) 228, 1213–1217 - PubMed

Publication types

Substances