. 2009 Dec 24;462(7276):1022-7.
doi: 10.1038/nature08627.

Dynamics of nucleosome remodelling by individual ACF complexes

Affiliations

Dynamics of nucleosome remodelling by individual ACF complexes

Timothy R Blosser et al. Nature. .

Abstract

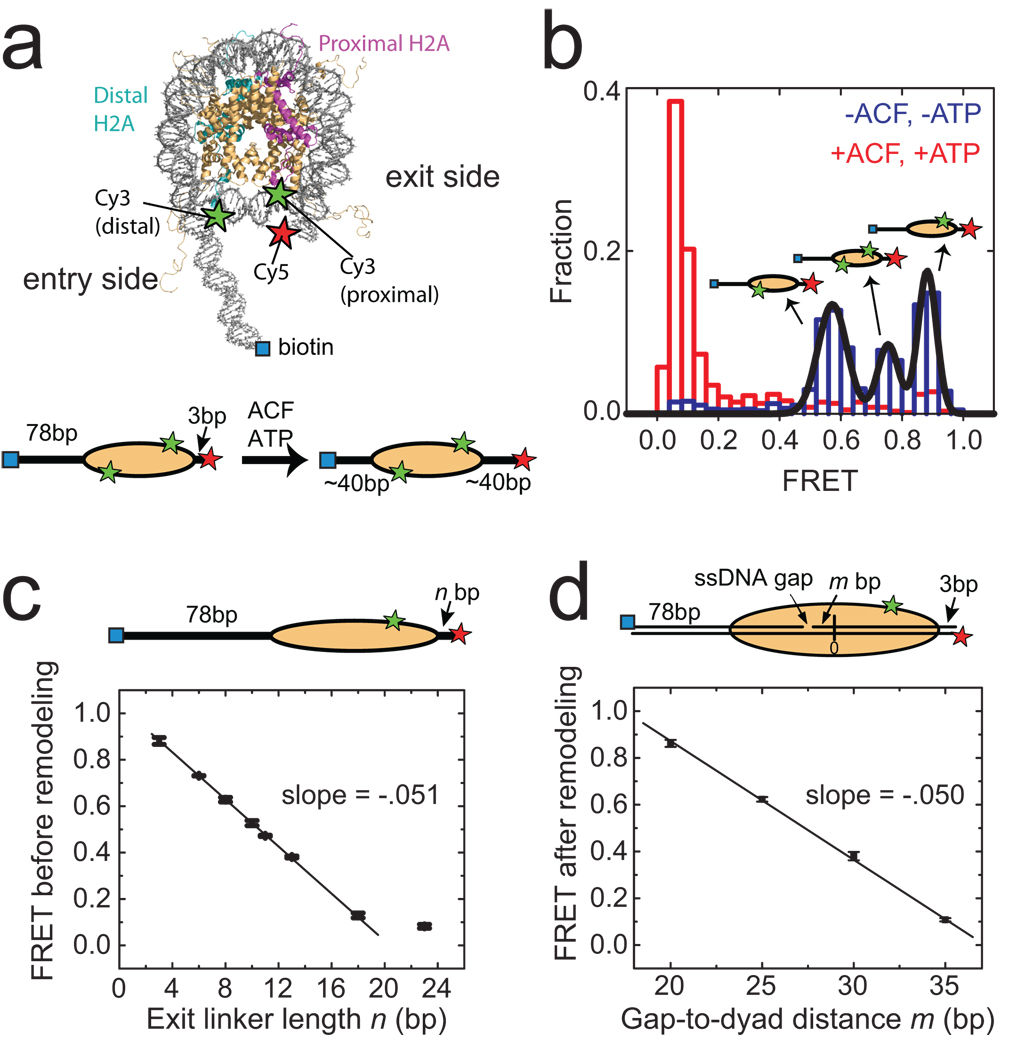
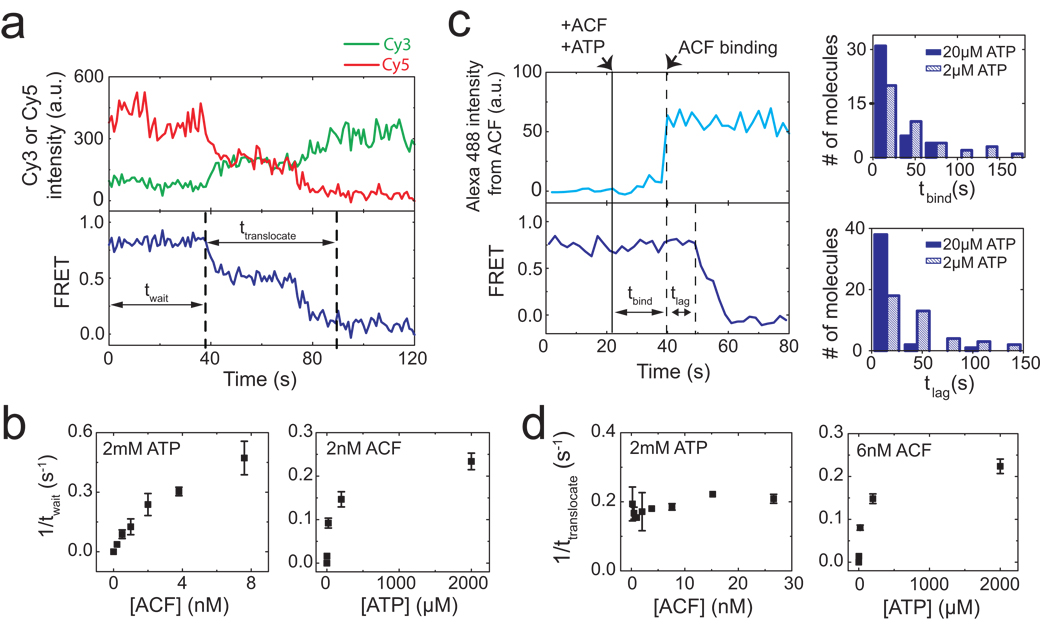
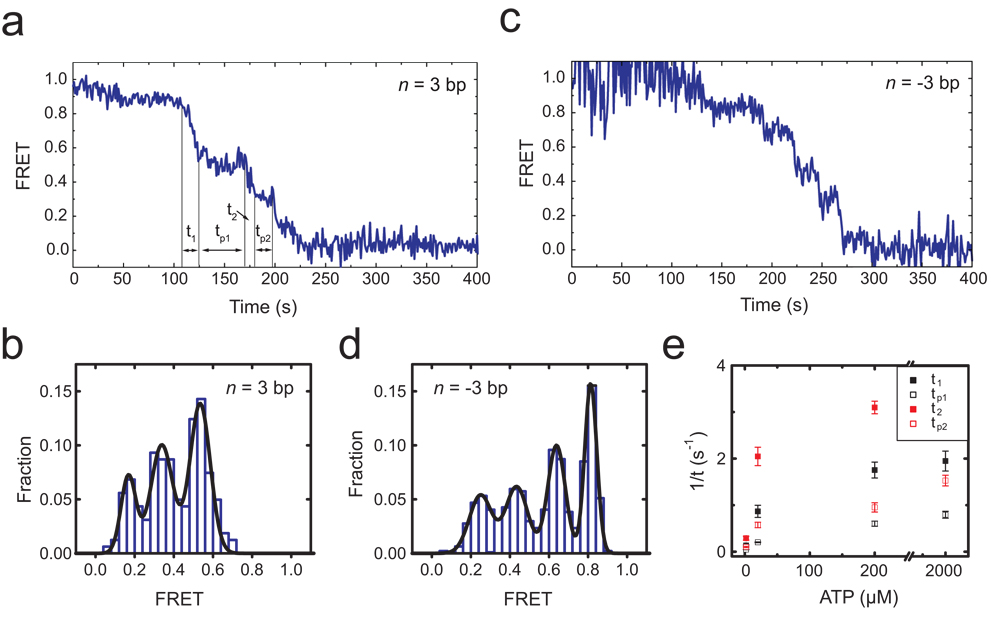
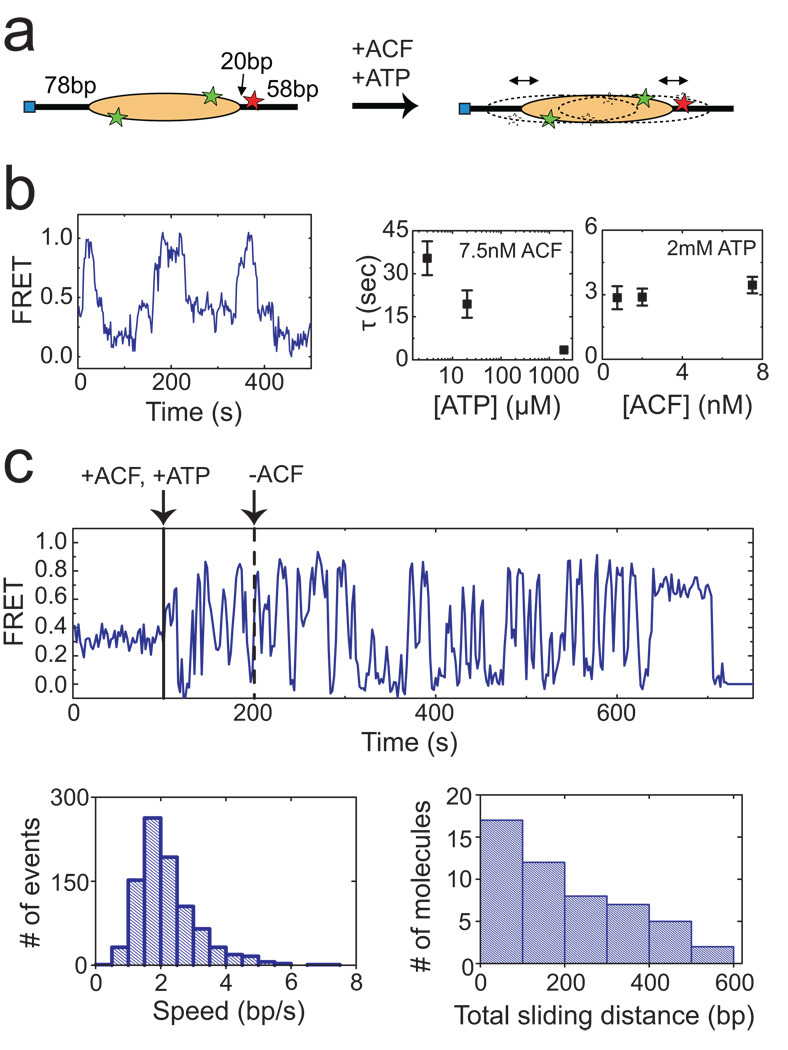
The ATP-dependent chromatin assembly and remodelling factor (ACF) functions to generate regularly spaced nucleosomes, which are required for heritable gene silencing. The mechanism by which ACF mobilizes nucleosomes remains poorly understood. Here we report a single-molecule FRET study that monitors the remodelling of individual nucleosomes by ACF in real time, revealing previously unknown remodelling intermediates and dynamics. In the presence of ACF and ATP, the nucleosomes exhibit gradual translocation along DNA interrupted by well-defined kinetic pauses that occurred after approximately seven or three to four base pairs of translocation. The binding of ACF, translocation of DNA and exiting of translocation pauses are all ATP-dependent, revealing three distinct functional roles of ATP during remodelling. At equilibrium, a continuously bound ACF complex can move the nucleosome back-and-forth many times before dissociation, indicating that ACF is a highly processive and bidirectional nucleosome translocase.


Figures

Figure 1
Figure 1. Monitoring ACF-catalyzed nucleosome remodelling by single-molecule FRET
a, (upper panel) The nucleosome structure with labelling sites for Cy3 and Cy5 indicated by green and red stars, respectively. Additional B-form DNA is modelled onto the entry and exit sides of the nucleosome to show the flanking DNA linkers. (lower panel) A linear nucleosome scheme showing the footprint of the histone octamer (yellow oval) on the DNA (black line) before and after ACF-catalyzed remodelling. b, The FRET distribution of the n = 3 bp nucleosomes before (blue bars) and after (red bars) remodelling. The three initial peaks centred at FRET = 0.88, 0.75 and 0.58 (derived from Gaussian fit, black line) result from the three distinct Cy3-labeling configurations. After equilibration with ACF and ATP, the FRET values reduce to below 0.1. c, The initial FRET value as a function of the exit linker DNA length (n). The data were fit to a line with a slope of −0.051 ± 0.002 (black line). The last point near zero FRET is excluded from the linear fit. In this and subsequent figures, data from nucleosomes with a single Cy3 dye on the proximal H2A subunit are presented. The selection criteria for these nucleosomes are described in Online Methods. d, The final FRET values after remodelling by ACF as a function of m, the number of base pairs between the ssDNA gap and the nucleosome dyad (denoted as 0). The linear fit (black line) gives a slope of −0.050 ± 0.002. Error bars are ± s. e.m.
Figure 2
Figure 2. Real-time dynamics of ACF-catalyzed nucleosome translocation
a, Donor fluorescence (green), acceptor fluorescence (red), and FRET (blue) traces showing the ACF-induced remodelling of a single nucleosome (n = 3 bp). ACF (6 nM) and ATP (2 µM) were added at time zero. The durations of the waiting phase and the translocation phase are denoted as twait and ttranslocate, respectively b, Dependence of the mean twait value on ACF and ATP concentrations. c, Simultaneous monitoring of the binding of ACF and the remodelling of nucleosomes. (left panels) The upper trace shows the fluorescence signal from the Alexa 488-labelled ACF. The lower trace shows FRET between Cy3 and Cy5 on the nucleosome. ACF (4 nM) and ATP (20 µM) were added at the time indicated by the solid black line. The binding event of ACF (indicated by the first dashed line) further divides twait into two phases, tbind and tlag. (right panels) The distributions of tbind and tlag at two different ATP concentrations and 4 nM ACF. The distributions at different ATP concentrations are statistically distinct with 95% confidence for tbind and more than 99% confidence for tlag according to the Kolmogorov-Smirnov test. d, Dependence of the mean ttranslocate value on ACF and ATP concentrations. Error bars are ± s.e.m.
Figure 3
Figure 3. ACF-catalyzed nucleosome translocation is interrupted by well defined kinetic pauses
a, FRET time trace of a nucleosome (n = 3 bp) showing kinetic pauses that divide the entire translocation phase into several translocation and pause sub-phases: t1, tp1, t2, tp2…. ACF (6 nM) and ATP (2 µM) were added at time zero. b, FRET distribution of the pauses observed for the n = 3 bp nucleosomes. The peak FRET values, 0.53, 0.34, and 0.17 (obtained from Gaussian fit, black line), corresponds to 6.9 bp of translocation between the initial position and the first pause, 3.8 bp between the first and second pauses, and 3.3 bp between the second and third pauses. c, FRET time trace of a n = −3 bp nucleosome after addition of ACF (6 nM) and ATP (2 µM) at time zero. The proximity of the initial donor and acceptor positions causes partial quenching of their fluorescence and thus relatively large fluctuations in initial FRET. d, FRET distribution of the pauses observed for the n = −3 bp nucleosomes. The peaks correspond to 7.3 bp of translocation between the initial position and the first pause, 3.4 bp between the first and second pauses, 4.0 bp between the second and third pauses, and 3.6 bp between the third and fourth pauses. e, ATP-dependence of the mean t1, tp1, t2, and tp2 values. Error bars are ± s.e.m.
Figure 4
Figure 4. ACF catalyzes processive and bidirectional nucleosome translocation
a, A centre-positioned nucleosome flanked by 78 bp of linker DNA on both sides is subject to remodelling. b, (left panel) FRET trace of a nucleosome in equilibrium with 7.5 nM ACF and 3 µM ATP showing back-and-forth translocation on DNA. (right panel) The characteristic time of the FRET fluctuations (τ) depends on ATP, but not on ACF, concentration. The τ values were derived from autocorrelation analysis as described in Online Methods. c, (upper panel) A FRET trace showing processive and bidirectional nucleosome translocation by a continuously bound ACF complex. ACF (3 nM) and ATP (2 mM) were added at the time indicated by the solid black line. Unbound ACF (but not ATP) was then removed from the solution at the time indicated by the dashed black line. (lower left panel) Distribution of the translocation speed within each segment of unidirectional translocation. (lower right panel) Distribution of the cumulative distance travelled by individual nucleosomes after removal of unbound ACF. Estimate of the travelling speed and distance is described in Online Methods. Error bars are ± s.e.m.

Similar articles

Cited by

References

    1. Becker PB, Horz W. ATP-dependent nucleosome remodeling. Annu Rev Biochem. 2002;71:247–273. - PubMed
    1. Narlikar GJ, Fan HY, Kingston RE. Cooperation between complexes that regulate chromatin structure and transcription. Cell. 2002;108:475–487. - PubMed
    1. Flaus A, Owen-Hughes T. Mechanisms for ATP-dependent chromatin remodelling: farewell to the tuna-can octamer? Curr Opin Genet Dev. 2004;14:165–173. - PubMed
    1. Smith CL, Peterson CL. ATP-dependent chromatin remodeling. Curr Top Dev Biol. 2005;65:115–147. - PubMed
    1. Clapier CR, Cairns BR. The biology of chromatin remodeling complexes. Annu Rev Biochem. 2009;78:273–304. - PubMed

Publication types

MeSH terms